Oregon Ranks in Top 5 for Highest Gas Prices


Monday, March 16, 2015

Despite the low prices Oregonians experienced at the beginning of the year, prices have increased by sixty cents per gallon.
Since most refineries are in the Midwest and near the Gulf Coast, states located further away pay more money for gasoline to be transported across the country.
The study further points out that drivers transporting the gas experience steep taxes that average around 18.4 cents per gallon.
This, in conjunction with the cost of crude oil prices continuing to increase, make a huge difference in how much consumers pay to fill their tanks.
“High regional gas prices this year can be attributed to increasing crude oil costs, routine refinery maintenance, and unexpected production issues,” said Avery Ash, a spokesman for AAA.
So despite the low prices Oregonians experienced at the beginning of the year, prices have increased by sixty cents per gallon. Currently, Oregonians expect to pay $2.88 per gallon, in addition to taxes.
Other states that made the Top Five List for states with the highest gas prices are California ($3.43 per gallon), Hawaii ($3.13), Alaska ($2.90), and Nevada ($2.88)
Related Slideshow: 15 Biggest Public Transit Systems in the U.S.
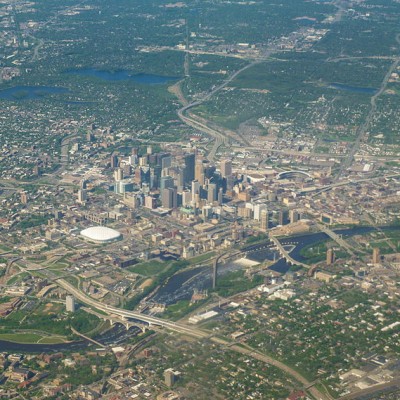


15. Minneapolis- St. Paul
14. Denver-Aurora, CO
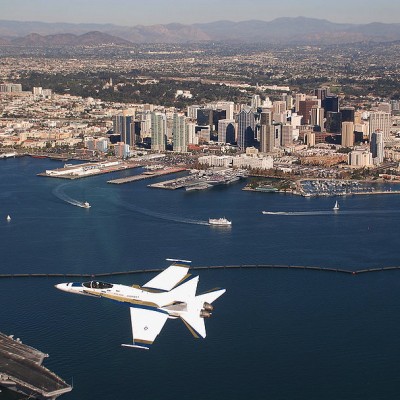
13. San Diego, CA
12. Baltimore, MD
11. Portland, OR
10. Atlanta, GA
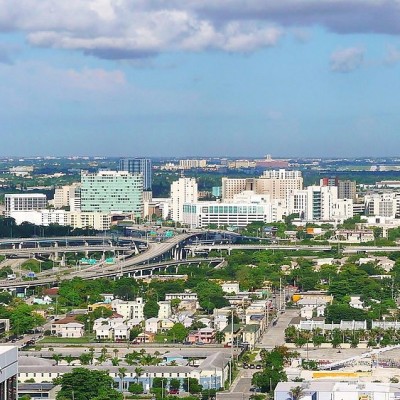
9. Miami, FL
8. Seattle, WA
7. Philadelphia, PA
6. Boston, MA
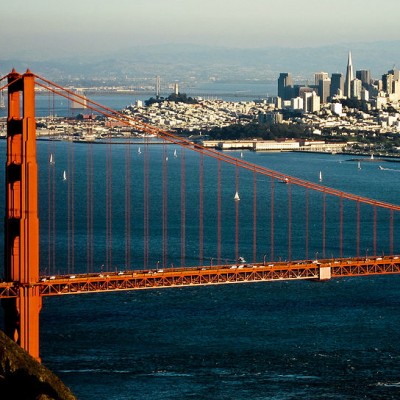
5. San Francisco-Oakland,
4. Washington DC
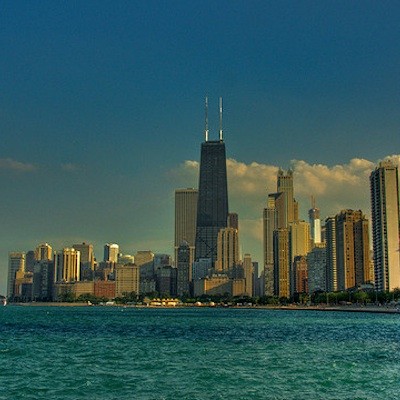
3. Chicago, IL
2. Los Angeles-Long Beach
1. New York-Newark, NY


Follow us on Pinterest Google + Facebook Twitter See It Read It