College Admissions: Forecasting Classes for Next Year


 Email to a friend
Permalink
Email to a friend
Permalink
Wednesday, February 25, 2015
Jodi Walder, GoLocalPDX College Admissions Expert
If you are in 8th – 11th grades this is probably the season during which you are asked to pick (forecast) your classes for next year. It’s important to understand that the choices you make now will impact the choices you get later when it comes to applying to college. When a college evaluates your application the admissions officers read your school profile first. This document (which is provided by your school counselor) gives them context so they understand the educational philosophy of your school and what options are available to you. Admissions officers want to know the rigor of your coursework—did you pick a challenging schedule, or one that was easier and allowed you more free time for non-academic pursuits? Here are some tips as you think through your choices for next year.
Know the Requirements for High School Graduation and State Colleges Entry
In many states the high school graduation requirements match up with the state college entrance requirements, but that is not true everywhere. Check the high school diploma requirements against the college websites to be sure. For example, in Oregon you can pass a class and gradate with a “D” in a required class, however the colleges expect a C- or better to meet the entrance requirement.
Know the Requirements for More Selective Schools
If you are a high-achieving student and considering a more selective school, it is important to know that the entrance requirements might be more rigorous than your graduation requirements. For example, you might be able to get your diploma with two years of foreign language, but some of the colleges you are considering might require three years of the same foreign language. A requirement that often trips up Oregon students considering University of California schools is at-least-one-year-of-the-same-type-of-art. Some Oregon students don’t take any visual or performing arts classes in high school because they want to double up on science or two languages, but that can cause a scramble senior year if the student decides to apply to a UC campus. Many students like to use freshman year to try out assorted electives, so they might choose drama for a semester and paint/draw for a semester. While both are arts classes, that student would need either drama 1 and 2 or paint/draw 1 and 2 (or an alternate visual or performing art) to meet the “one-year-of-the-same-art” requirement.
Academic Rigor is Valued
Take the hardest classes you can handle without undue stress. No college expects you to do AP Everything, but selective schools do want to see you stretch your thinking capabilities and push yourself with tough coursework. In most cases, it is better to get a “B” in an advanced class than an “A” in less challenging class on the same subject; however it is not so great to get a “C”, so push yourself without overextending. Sleep is also critical to your health and attitude, so make sure your class choices/homework load allow you sufficient hours of sleep each night.
Go Deep in your Areas of Interest
If you are a math and science whiz you should max out those options at your school. The same advice holds true whether you are passionate about history or literature or languages—take the hardest classes offered in your specific areas of interest and inherent ability. Then pursue academic opportunities beyond what is offered by taking a class at a local college, trying a MOOC like EdX or Coursera, or doing mentored, independent research. I know scheduling constraints can be hard. Maybe you love physics and French and the advanced course for each is only offered once per day during the same period. These are tough choices to make, so get guidance from your parents and school or independent counselor.
Make Choices that Excite You
I do not believe that it is smart to make choices about how you spend your time and energy simply to impress a college. Pick classes that are exciting to you, and balance your academics with a few activities you really love. Genuine interest in a subject will lead to better performance, plus you will be a lot happier.
Turn in Your Forecasting Paperwork on Time
School counselors and administrators work really hard. Be respectful and appreciative of all they do for you. Fill out your forecasting sheet accurately, legibly, and be sure to get any needed parental signatures. If you want or need guidance, ask! A counselor would rather spend time with you now than spend time in the fall trying to rework your schedule.
Jodi Walder-Biesanz is the founder of Portland, Oregon-based College Admission Coach LLC, which helps students identify and gain admission to right-fit schools where they will thrive academically and personally. Contact her at [email protected].
Related Slideshow: Top 100 Oregon High Schools
GoLocalPDX has ranked high schools across the state based on a method developed at Babson College, Mass. See below for the top 100 schools in the Beaver State.

Prev
Next
#100
South Albany High School
Greater Albany Public School District
Enrollment: 1260
Economically disadvantaged: 55%
Met or exceeded reading standards: 86.9%
Met or exceeded math standards: 65.5%
Met or exceeded writing standards: 68.1%
Met or exceeded science standards: 54.6%
Four year graduation rate: 76.2%
Photo Credit: kamera kızı via Compfight cc

Prev
Next
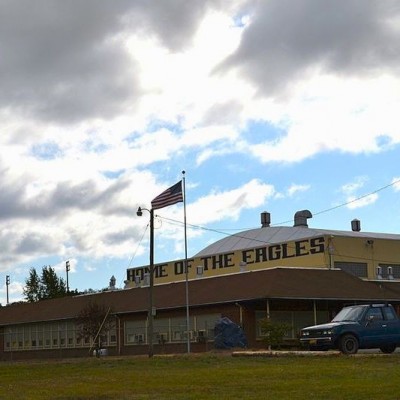
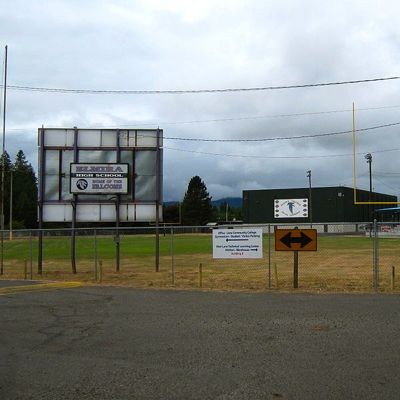
#99
Yamhill Carlton High
Yamhill Carlton School District
Enrollment: 375
Economically disadvantaged: 32%
Met or exceeded reading standards: 93.8%
Met or exceeded math standards: 60.8%
Met or exceeded writing standards: 47.9%
Met or exceeded science standards: 69.6%
Four year graduation rate: 83.8%

Prev
Next
#98
Phoenix High
Phoenix-Talent School District
Enrollment: 695
Economically disadvantaged: 54%
Met or exceeded reading standards: 88.3%
Met or exceeded math standards: 74.7%
Met or exceeded writing standards: 64%
Met or exceeded science standards: 56.4%
Four year graduation rate: 70.6%
Prev
Next
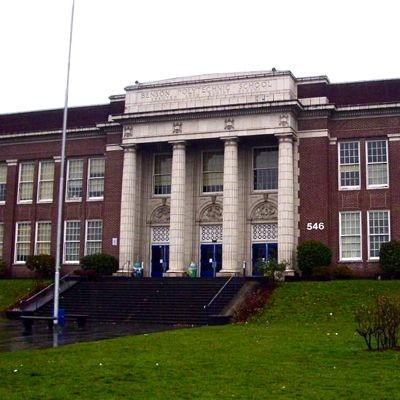
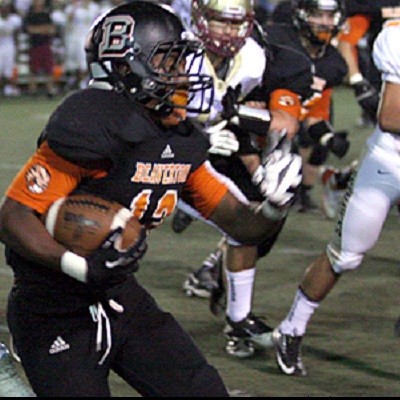
#97
Benson Polytechnic High
Portland School District
Enrollment: 819
Economically disadvantaged: 68%
Met or exceeded reading standards: 87.1%
Met or exceeded math standards: 75.9%
Met or exceeded writing standards: 40.8%
Met or exceeded science standards: 84%
Four year graduation rate: 82.2%
Prev
Next
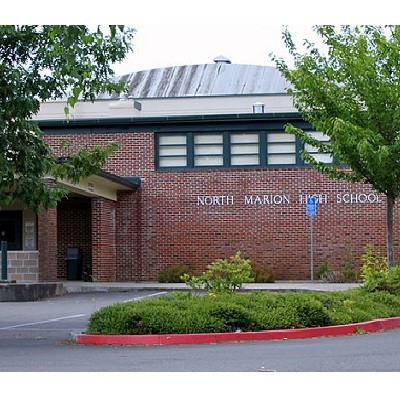
#96
North Marion High
North Marion School District
Enrollment: 588
Economically disadvantaged: 62%
Met or exceeded reading standards: 86.3%
Met or exceeded math standards: 64.9%
Met or exceeded writing standards: 58.6%
Met or exceeded science standards: 58.5%
Four year graduation rate: 87.6%

Prev
Next
#95
Hidden Valley High
Three Rivers/Josephine County School District
Enrollment: 681
Economically disadvantaged: 53%
Met or exceeded reading standards: 83.7%
Met or exceeded math standards: 71.4%
Met or exceeded writing standards: 52.2%
Met or exceeded science standards: 66.7%
Four year graduation rate: 68.3%
Photo Credit: dcJohn via Compfight cc
Photo Credit: sleepyneko via Compfight cc

Prev
Next
#94
North Valley High
Three Rivers/Josephine County School District
Enrollment: 522
Economically disadvantaged: 51%
Met or exceeded reading standards: 89.2
Met or exceeded math standards: 56%
Met or exceeded writing standards: 46.8%
Met or exceeded science standards: 72.2%
Four year graduation rate: 68.3%
Photo Credit: naosuke ii via Compfight cc
Photo Credit: peteoshea via Compfight cc

Prev
Next
#93
Stayton High
North Santiam School District
Enrollment: 749
Economically disadvantaged: 48%
Met or exceeded reading standards: 85.3%
Met or exceeded math standards: 68.9%
Met or exceeded writing standards: 56.8%
Met or exceeded science standards: 70.6%
Four year graduation rate: 70.1%
Photo Credit: katerha via Compfight cc
Prev
Next
#92
Liberty High
Hillsboro School District
Enrollment: 1386
Economically disadvantaged: 46%
Met or exceeded reading standards: 89.8%
Met or exceeded math standards: 76%
Met or exceeded writing standards: 53.3%
Met or exceeded science standards: 65.8%
Four year graduation rate: 79.6%
Photo Credit: Aboutmovies, CC

Prev
Next
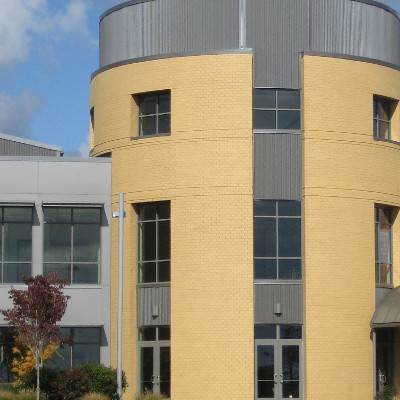
#91
Academy of Arts and Academics
Springfield School District
Enrollment: 280
Economically disadvantaged: 49%
Met or exceeded reading standards: 90.7%
Met or exceeded math standards: 57.4%
Met or exceeded writing standards: 65.4%
Met or exceeded science standards: 73.6%
Four year graduation rate: 84.1%
Prev
Next
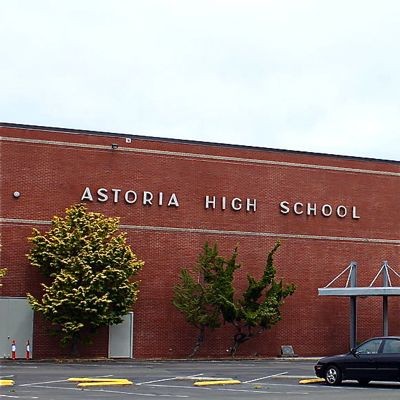
#90
Astoria Senior High
Astoria School District
Enrollment: 572
Economically disadvantaged: 48%
Met or exceeded reading standards: 93.1%
Met or exceeded math standards: 73.8%
Met or exceeded writing standards: 74.3%
Met or exceeded science standards: 52.7%
Four year graduation rate: 59.9%

Prev
Next
#89
Crane Union high School
Harney County Union High School District
Enrollment: 69
Economically disadvantaged: 39%
Met or exceeded reading standards: 97.5%
Met or exceeded math standards: 97.5%
Met or exceeded writing standards: 52.2%
Met or exceeded science standards: 69.6%
Four year graduation rate: 95%

Prev
Next
#88
Vale High
Vale School District
Enrollment: 234
Economically disadvantaged: 52%
Met or exceeded reading standards: 84.6%
Met or exceeded math standards: 64.6%
Met or exceeded writing standards: 63.1%
Met or exceeded science standards: 81.5%
Four year graduation rate: 88.2%

Prev
Next
#87
Gold Beach High
Central Curry School District
Enrollment: 173
Economically disadvantaged: 57%
Met or exceeded reading standards: 91.9%
Met or exceeded math standards: 81.1%
Met or exceeded writing standards: 62.2%
Met or exceeded science standards: 80.8%
Four year graduation rate: 56.7%
Photo Credit: Google
Prev
Next
#86
Dallas High
Dallas School District
Enrollment: 979
Economically disadvantaged: 35%
Met or exceeded reading standards: 84.4%
Met or exceeded math standards: 72.8%
Met or exceeded writing standards: 49%
Met or exceeded science standards: 69.8%
Four year graduation rate: 52.9%
Photo Credit: Tedder - Own work. Licensed under CC BY 3.0 via Wikimedia Commons.
Prev
Next
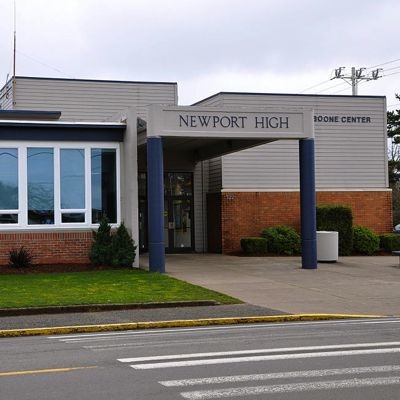
#85
Newport High School
Lincoln County School District
Enrollment: 528
Economically disadvantaged: 43%
Met or exceeded reading standards: 91.7%
Met or exceeded math standards: 81.7%
Met or exceeded writing standards: 62.6%
Met or exceeded science standards: 57.8%
Four year graduation rate: 70.7%
Photo Credit: Finetooth - Own work. Licensed under CC BY-SA 3.0 via Wikimedia Commons.
Prev
Next
#84
LaPine Senior High
Bend-LaPine School District
Enrollment: 439
Economically disadvantaged: 63%
Met or exceeded reading standards: 88.9%
Met or exceeded math standards: 72.4%
Met or exceeded writing standards: 47.5%
Met or exceeded science standards: 62.2%
Four year graduation rate: 74.7%
Photo Credit: samantha celera via Compfight cc
Prev
Next
#83
Aloha High
Beaverton School District
Enrollment: 1962
Economically disadvantaged: 61%
Met or exceeded reading standards: 82.7%
Met or exceeded math standards: 64.5%
Met or exceeded writing standards: 62.2%
Met or exceeded science standards: 60.2%
Four year graduation rate: 72.7%

Prev
Next
#82
La Grande High
La Grande School District
Enrollment: 560
Economically disadvantaged: 37%
Met or exceeded reading standards: 84.3%
Met or exceeded math standards: 60%
Met or exceeded writing standards: 56.4%
Met or exceeded science standards: 59.4%
Four year graduation rate: 74.1%
Photo Credit: Fiorenza Thompson via Compfight cc
Prev
Next
#81
Yoncalla High
Yoncalla School District
Enrollment: 87
Economically disadvantaged: 70%
Met or exceeded reading standards: 97.5%
Met or exceeded math standards: 58.8%
Met or exceeded writing standards: 64.7%
Met or exceeded science standards: 52.9%
Four year graduation rate: 78.8%
Visitor7 - Own work. Licensed under CC BY-SA 3.0 via Wikimedia Commons.
Prev
Next
#80
Elmira High
Fern Ridge School District
Enrollment: 436
Economically disadvantaged: 52%
Met or exceeded reading standards: 88.7%
Met or exceeded math standards: 70.1%
Met or exceeded writing standards: 63.5%
Met or exceeded science standards: 66.7%
Four year graduation rate: 77.6%
Photo Credit: Katr67 - Own work. Licensed under Public domain via Wikimedia Commons.
Prev
Next
#79
Churchill High
Eugene School District
Enrollment: 1020
Economically disadvantaged: 44%
Met or exceeded reading standards: 82.5%
Met or exceeded math standards: 73.6%
Met or exceeded writing standards: 68.8%
Met or exceeded science standards: 61.3%
Four year graduation rate: 69.2%
Photo Credit: EvelynGiggles via Compfight cc
Prev
Next
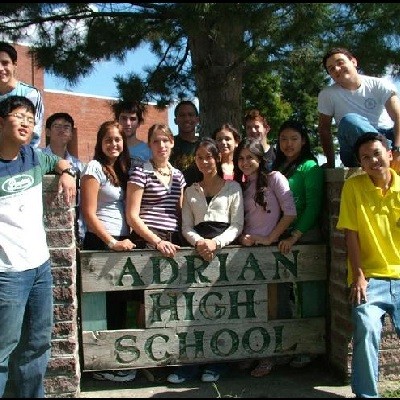
#78
Adrian High
Adrian School District
Enrollment: 64
Economically disadvantaged: 55%
Met or exceeded reading standards: 97.5%
Met or exceeded math standards: 57.1%
Met or exceeded writing standards: 71.4%
Met or exceeded science standards: 57.1%
Four year graduation rate: 95.5%
Prev
Next
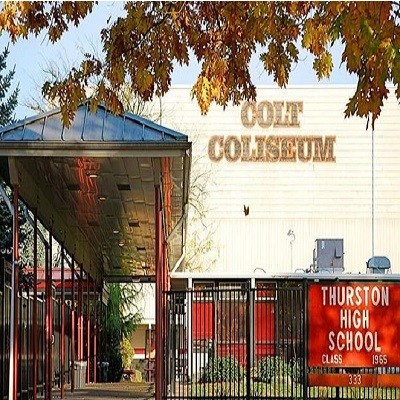
#77
Thurston High
Springfield School District
Enrollment: 1387
Economically disadvantaged: 42%
Met or exceeded reading standards: 85%
Met or exceeded math standards: 68.8%
Met or exceeded writing standards: 73.4%
Met or exceeded science standards: 57.6%
Four year graduation rate: 74.9%

Prev
Next
#76
North Medford High
Medford School District
Enrollment: 1612
Economically disadvantaged: 50%
Met or exceeded reading standards: 89.6%
Met or exceeded math standards: 74.6%
Met or exceeded writing standards: 55.1%
Met or exceeded science standards: 73.9%
Four year graduation rate: 68%
Photo Credit: theilr via Compfight cc

Prev
Next
#75
Klamath Union High
Klamath Falls City School District
Enrollment: 663
Economically disadvantaged: 56%
Met or exceeded reading standards: 81.9%
Met or exceeded math standards: 69.5%
Met or exceeded writing standards: 40.2%
Met or exceeded science standards: 54.8%
Four year graduation rate: 83.4%
Photo Credit: User:bobjgalindo - Own work. Licensed under CC BY-SA 3.0 via Wikimedia Commons.

Prev
Next
#74
Sandy High
Oregon Trail School District
Enrollment: 1286
Economically disadvantaged: 36%
Met or exceeded reading standards: 86.4%
Met or exceeded math standards: 69%
Met or exceeded writing standards: 59%
Met or exceeded science standards: 71.6%
Four year graduation rate: 76%

Prev
Next
#73
Henley High
Klamath County School District
Enrollment: 608
Economically disadvantaged: 33%
Met or exceeded reading standards: 86.7%
Met or exceeded math standards: 74.7%
Met or exceeded writing standards: 54.7%
Met or exceeded science standards: 64.7%
Four year graduation rate: 84.9%

Prev
Next
#72
Pendleton High
Pendleton School District
Enrollment: 881
Economically disadvantaged: 43%
Met or exceeded reading standards: 88.8%
Met or exceeded math standards: 82.7%
Met or exceeded writing standards: 49.7%
Met or exceeded science standards: 61.2%
Four year graduation rate: 75.5%

Prev
Next
#71
Cottage Grove High
South Lane School District
Enrollment: 761
Economically disadvantaged: 59%
Met or exceeded reading standards: 90.4%
Met or exceeded math standards: 70.9%
Met or exceeded writing standards: 54.6%
Met or exceeded science standards: 64%
Four year graduation rate: 87.6%
Photo Credit: Visitor7 - Own work. Licensed under CC BY-SA 3.0 via Wikimedia Commons.
Prev
Next
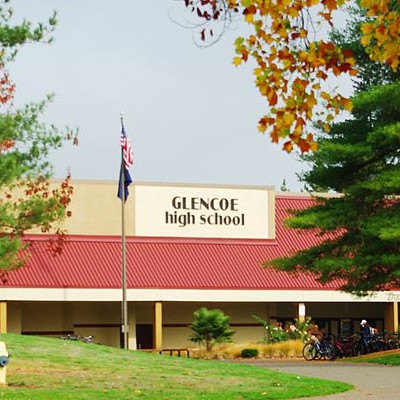
#70
Glencoe High
Hillsboro School District
Enrollment: 1601
Economically disadvantaged: 39%
Met or exceeded reading standards: 88.3%
Met or exceeded math standards: 70.5%
Met or exceeded writing standards: 58.4%
Met or exceeded science standards: 69.9%
Four year graduation rate: 77.1%
Prev
Next
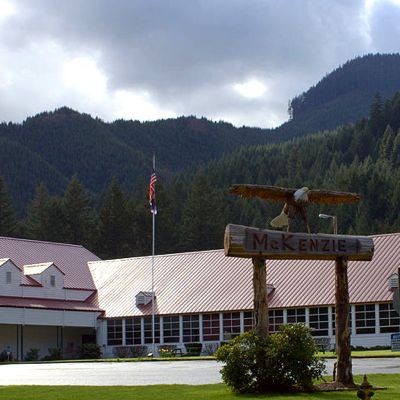
#69
McKenzie High
McKenzie School District
Enrollment: 67
Economically disadvantaged: 61%
Met or exceeded reading standards: 91.7%
Met or exceeded math standards: 41.7%
Met or exceeded writing standards: 50%
Met or exceeded science standards: 83.3%
Four year graduation rate: 68%
Photo Credit: Tedder - Own work. Licensed under CC BY 3.0 via Wikimedia Commons.

Prev
Next
#68
St. Helens High
St. Helens School District
Enrollment: 974
Economically disadvantaged: 36%
Met or exceeded reading standards: 91.4%
Met or exceeded math standards: 72.4%
Met or exceeded writing standards: 59.2%
Met or exceeded science standards: 66%
Four year graduation rate: 75.7%
Photo Credit: M.O. Stevens - Own work. Licensed under CC BY-SA 3.0 via Wikimedia Commons.
Prev
Next
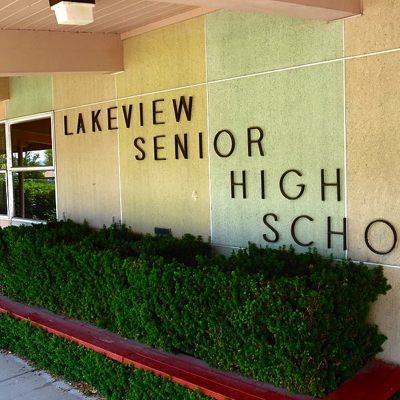
#67
Lakeview Senior High
Lake County School District
Enrollment: 223
Economically disadvantaged: 45%
Met or exceeded reading standards: 87.8%
Met or exceeded math standards: 69.4%
Met or exceeded writing standards: 66.7%
Met or exceeded science standards: 73.5%
Four year graduation rate: 88.1%
Prev
Next
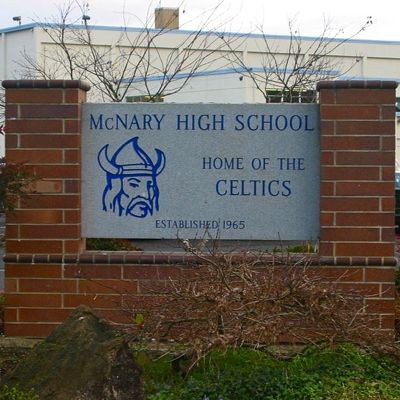
#66
McNary High
Salem-Keizer School District
Enrollment: 1924
Economically disadvantaged: 49%
Met or exceeded reading standards: 89.8%
Met or exceeded math standards: 75%
Met or exceeded writing standards: 59.5%
Met or exceeded science standards: 66.1%
Four year graduation rate: 82%

Prev
Next
#65
Banks High
Banks School District
Enrollment: 384
Economically disadvantaged: 23%
Met or exceeded reading standards: 91.5%
Met or exceeded math standards: 79.8%
Met or exceeded writing standards: 57.4%
Met or exceeded science standards: 81.1%
Four year graduation rate: 80.6%
Photo Credit: valakirka via Compfight cc

Prev
Next
#64
Clackamas Middle College
North Clackamas School District
Enrollment: 290
Economically disadvantaged: 28%
Met or exceeded reading standards: 91.4%
Met or exceeded math standards: 76.3%
Met or exceeded writing standards: 59.3%
Met or exceeded science standards: 78%
Four year graduation rate: 32.6%
Photo Credit: slightly everything via Compfight cc

Prev
Next
#63
South Medford High
Medford School District
Enrollment: 1698
Economically disadvantaged: 56%
Met or exceeded reading standards: 87.9%
Met or exceeded math standards: 76.8%
Met or exceeded writing standards: 61.7%
Met or exceeded science standards: 71.2%
Four year graduation rate: 80.4%
Photo Credit: @RunRockPrincess via Compfight cc
Prev
Next
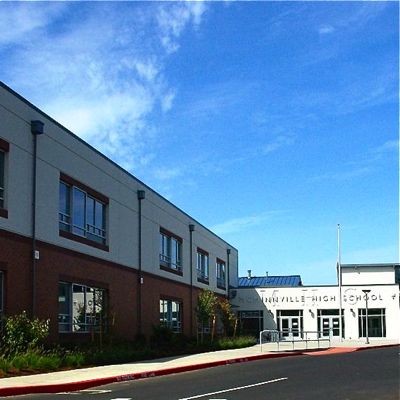
#62
McMinnville High
McMinnville School District
Enrollment: 1864
Economically disadvantaged: 48%
Met or exceeded reading standards: 91.1%
Met or exceeded math standards: 73.3%
Met or exceeded writing standards: 66%
Met or exceeded science standards: 64.6%
Four year graduation rate: 77.1%
Prev
Next
#61
Estacada High
Estacada School District
Enrollment: 589
Economically disadvantaged: 46%
Met or exceeded reading standards: 89.9%
Met or exceeded math standards: 77.7%
Met or exceeded writing standards: 59%
Met or exceeded science standards: 66.4%
Four year graduation rate: 71.8%

Prev
Next
#60
Philomath High
Philomath School District
Enrollment: 519
Economically disadvantaged: 29%
Met or exceeded reading standards: 82.8%
Met or exceeded math standards: 75%
Met or exceeded writing standards: 56.3%
Met or exceeded science standards: 69.5%
Four year graduation rate: 75%

Prev
Next
#59
Weston-McEwen High
Athena-Weston School District
Enrollment: 164
Economically disadvantaged: 33%
Met or exceeded reading standards: 97.5%
Met or exceeded math standards: 61.1%
Met or exceeded writing standards: 76.5%
Met or exceeded science standards: 47.2%
Four year graduation rate: 75.7%
Prev
Next
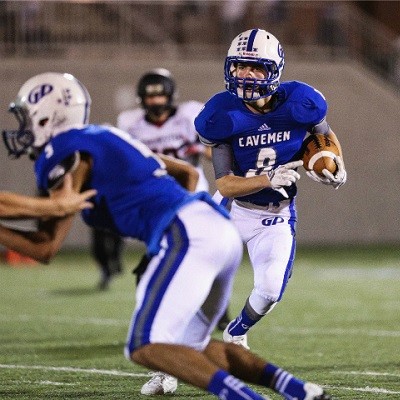
#58
Grants Pass High
Grants Pass School District
Enrollment: 1734
Economically disadvantaged: 55%
Met or exceeded reading standards: 90.3%
Met or exceeded math standards: 68.8%
Met or exceeded writing standards: 68.3%
Met or exceeded science standards: 72.3%
Four year graduation rate: 69%

Prev
Next
#57
North Eugene High
Eugene School District
Enrollment: 927
Economically disadvantaged: 54%
Met or exceeded reading standards: 88.1%
Met or exceeded math standards: 71.2%
Met or exceeded writing standards: 68.3%
Met or exceeded science standards: 63%
Four year graduation rate: 70.7%
Prev
Next
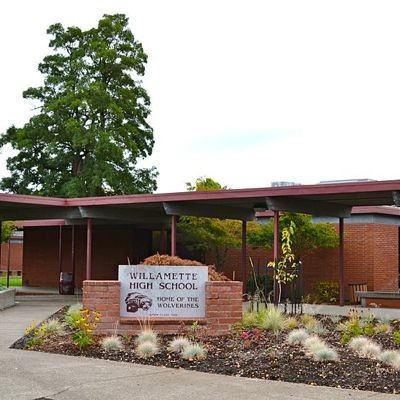
#56
Willamette High
Bethel School District
Enrollment: 1452
Economically disadvantaged: 48%
Met or exceeded reading standards: 89.6%
Met or exceeded math standards: 69.5%
Met or exceeded writing standards: 77.1%
Met or exceeded science standards: 68.2%
Four year graduation rate: 73%

Prev
Next
#55
Putnam High
North Clackamas School District
Enrollment: 1196
Economically disadvantaged: 39%
Met or exceeded reading standards: 88.6%
Met or exceeded math standards: 73.4%
Met or exceeded writing standards: 69.9%
Met or exceeded science standards: 59.3%
Four year graduation rate: 75.7%

Prev
Next
#54
Neah-Kah-Nie High
Neah-Kah Nie School District
Enrollment: 181
Economically disadvantaged: 54%
Met or exceeded reading standards: 83.7%
Met or exceeded math standards: 58.5%
Met or exceeded writing standards: 41.9%
Met or exceeded science standards: 97.5%
Four year graduation rate: 87.5%
Photo Credit: albertogp123 via Compfight cc
Prev
Next
#53
Scappoose High
Scappoose School District
Enrollment: 692
Economically disadvantaged: 28%
Met or exceeded reading standards: 89.6%
Met or exceeded math standards: 85.2%
Met or exceeded writing standards: 54.6%
Met or exceeded science standards: 84.4%
Four year graduation rate: 80.6%
Prev
Next
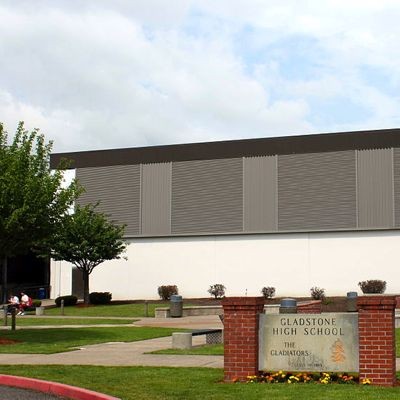
#52
Gladstone High
Gladstone School District
Enrollment: 677
Economically disadvantaged: 40%
Met or exceeded reading standards: 88.7%
Met or exceeded math standards: 77.5%
Met or exceeded writing standards: 66%
Met or exceeded science standards: 82.2%
Four year graduation rate: 78.9%
Prev
Next
#51
Franklin High
Portland School District
Enrollment: 1387
Economically disadvantaged: 56%
Met or exceeded reading standards: 89.2%
Met or exceeded math standards: 77.7%
Met or exceeded writing standards: 68.1%
Met or exceeded science standards: 59.8%
Four year graduation rate: 78.4%
Prev
Next
#50
Seaside High
Seaside High School
Enrollment: 453
Economically disadvantaged: 52%
Met or exceeded reading standards: 91.2%
Met or exceeded math standards: 70.3%
Met or exceeded writing standards: 60.8%
Met or exceeded science standards: 65.3%
Four year graduation rate: 69.5%

Prev
Next
#49
Siuslaw High
Siuslaw School District
Enrollment: 409
Economically disadvantaged: 53%
Met or exceeded reading standards: 89.4%
Met or exceeded math standards: 65.1
Met or exceeded writing standards: 73.3%
Met or exceeded science standards: 77.1%
Four year graduation rate: 65.9%
_400_400_90.JPG)
Prev
Next
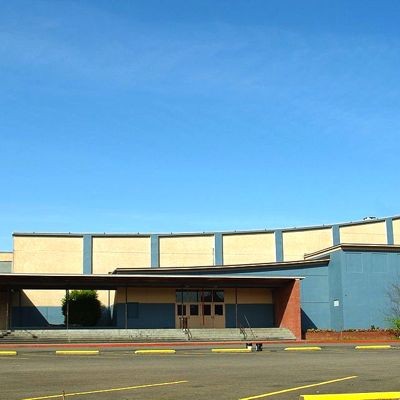
#48
Century High
Hillsboro School District
Enrollment: 1608
Economically disadvantaged: 43%
Met or exceeded reading standards: 87.8
Met or exceeded math standards: 78.6%
Met or exceeded writing standards: 62.7%
Met or exceeded science standards: 72.9%
Four year graduation rate: 84.8%

Prev
Next
#47
Junction City High
Junction City School District
Enrollment: 532
Economically disadvantaged: 54%
Met or exceeded reading standards: 85.6%
Met or exceeded math standards: 76.8%
Met or exceeded writing standards: 56.8%
Met or exceeded science standards: 64.8%
Four year graduation rate: 65.1%
Photo Credit: crazytales562 via Compfight cc
Prev
Next
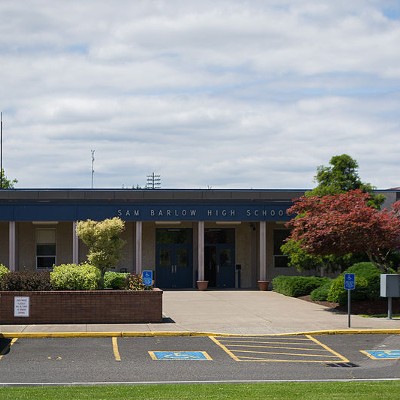
#46
Sam Barlow High
Gresham-Barlow School District
Enrollment: 1651
Economically disadvantaged: 38%
Met or exceeded reading standards: 84.5%
Met or exceeded math standards: 78.4%
Met or exceeded writing standards: 68.8%
Met or exceeded science standards: 76.7%
Four year graduation rate: 81.8%
Prev
Next
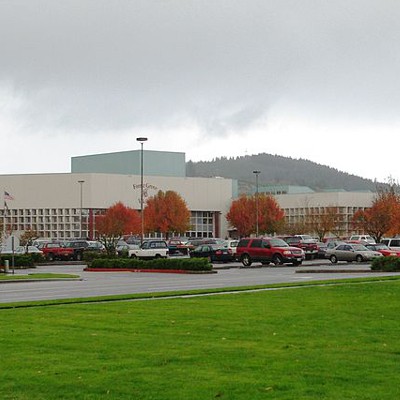
#45
Forest Grove High
Forrest Grove School District
Enrollment: 1779
Economically disadvantaged: 59%
Met or exceeded reading standards: 89.4%
Met or exceeded math standards: 85.7%
Met or exceeded writing standards: 66.6%
Met or exceeded science standards: 61.1%
Four year graduation rate: 72.5%
Prev
Next
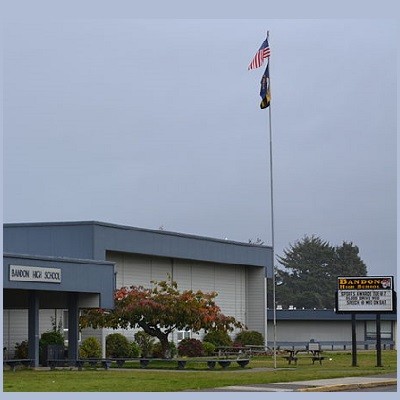
#44
Bandon Senior High
Bandon School District
Enrollment: 242
Economically disadvantaged: 60%
Met or exceeded reading standards: 86.1%
Met or exceeded math standards: 68.1%
Met or exceeded writing standards: 56.3%
Met or exceeded science standards: 70.4%
Four year graduation rate: 72.9%

Prev
Next
#43
South Salem High
Salem-Keizer School District
Enrollment: 1835
Economically disadvantaged: 49%
Met or exceeded reading standards: 89.5%
Met or exceeded math standards: 73.3%
Met or exceeded writing standards: 66.2%
Met or exceeded science standards: 66.5%
Four year graduation rate: 81.9%

Prev
Next
#42
Hood River Valley High
Hood River County School District
Enrollment: 1218
Economically disadvantaged: 57%
Met or exceeded reading standards: 87.1%
Met or exceeded math standards: 78.5%
Met or exceeded writing standards: 69.7%
Met or exceeded science standards: 53.5%
Four year graduation rate: 77.4%

Prev
Next
#41
North Douglas High
North Doughlas School District
Enrollment: 98
Economically disadvantaged: 45%
Met or exceeded reading standards: 91.3%
Met or exceeded math standards: 78.3%
Met or exceeded writing standards: 72.7%
Met or exceeded science standards: 60.9%
Four year graduation rate: 69%

Prev
Next
#40
Baker High
Baker School District
Enrollment: 501
Economically disadvantaged: 47%
Met or exceeded reading standards: 84.6%
Met or exceeded math standards: 73.6%
Met or exceeded writing standards: 65.9%
Met or exceeded science standards: 75.3%
Four year graduation rate: 77.8%
Prev
Next
#39
Oakland High
Oakland School District
Enrollment: 185
Economically disadvantaged: 50%
Met or exceeded reading standards: 91.5
Met or exceeded math standards: 83%
Met or exceeded writing standards: 68.1%
Met or exceeded science standards: 83%
Four year graduation rate: 86.1%
Prev
Next
#38
Newberg Senior High
Newberg School District
Enrollment: 1508
Economically disadvantaged: 42%
Met or exceeded reading standards: 87.9%
Met or exceeded math standards: 77.6%
Met or exceeded writing standards: 71.8%
Met or exceeded science standards: 68.3%
Four year graduation rate: 78.2%

Prev
Next
#37
West Salem High
Salem-Keizer School District
Enrollment: 1646
Economically disadvantaged: 35%
Met or exceeded reading standards: 92.7%
Met or exceeded math standards: 83.5%
Met or exceeded writing standards: 74.6%
Met or exceeded science standards: 74.2%
Four year graduation rate: 86.3%
Prev
Next
#36
Canby High
Canby School District
Enrollment: 1481
Economically disadvantaged: 32%
Met or exceeded reading standards: 87.3%
Met or exceeded math standards: 84%
Met or exceeded writing standards: 71.5%
Met or exceeded science standards: 61.6%
Four year graduation rate: 82.5%

Prev
Next
#35
Burns High
Harney County School District
Enrollment: 208
Economically disadvantaged: 33%
Met or exceeded reading standards: 76.2%
Met or exceeded math standards: 69%
Met or exceeded writing standards: 40.5%
Met or exceeded science standards: 83.3%
Four year graduation rate: 96.2%
Prev
Next
#34
Sheldon High
Eugene School District
Enrollment: 1399
Economically disadvantaged: 29%
Met or exceeded reading standards: 91.4%
Met or exceeded math standards: 77.7%
Met or exceeded writing standards: 69.1%
Met or exceeded science standards: 76.6%
Four year graduation rate: 72.4%
Prev
Next
#33
Oregon City Senior High
Oregon City School District
Enrollment: 2117
Economically disadvantaged: 34%
Met or exceeded reading standards: 97.5%
Met or exceeded math standards: 90.8%
Met or exceeded writing standards: 63%
Met or exceeded science standards: 76.7%
Four year graduation rate: 83%
Prev
Next
#32
Beaverton High
Beaverton School District
Enrollment: 1588
Economically disadvantaged: 43%
Met or exceeded reading standards: 90%
Met or exceeded math standards: 76.7%
Met or exceeded writing standards: 70.7%
Met or exceeded science standards: 65.4%
Four year graduation rate: 74.2%
Prev
Next
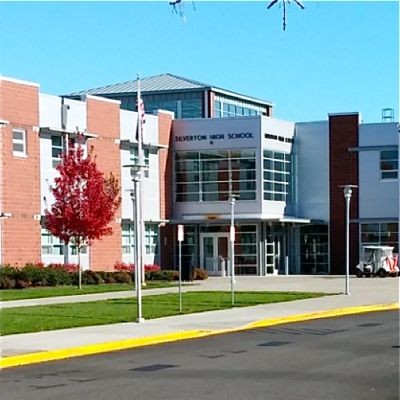
#31
Silverton High
Silver Falls School District
Enrollment: 1179
Economically disadvantaged: 41%
Met or exceeded reading standards: 86.1%
Met or exceeded math standards: 74.1%
Met or exceeded writing standards: 71.9%
Met or exceeded science standards: 72.1 %
Four year graduation rate: 77.7%
Prev
Next
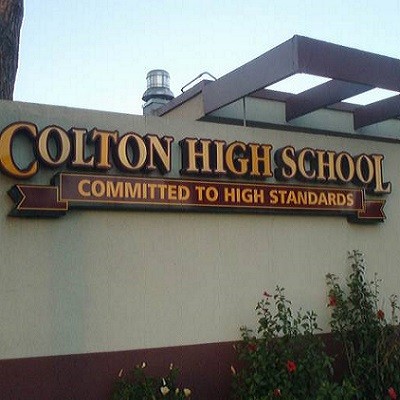
#30
Colton High
Colton School District
Enrollment: 215
Economically disadvantaged: 28%
Met or exceeded reading standards: 90%
Met or exceeded math standards: 76%
Met or exceeded writing standards: 68%
Met or exceeded science standards: 85.1%
Four year graduation rate: 95.2%

Prev
Next
#29
Bend Senior High
Bend-LaPine School District
Enrollment: 1527
Economically disadvantaged: 40%
Met or exceeded reading standards: 92.7%
Met or exceeded math standards: 88.4%
Met or exceeded writing standards: 65.9%
Met or exceeded science standards: 75.6%
Four year graduation rate: 78.7%

Prev
Next
#28
Tualatin High
Tigard-Tualatin School District
Enrollment: 1714
Economically disadvantaged: 27%
Met or exceeded reading standards: 92.2%
Met or exceeded math standards: 76.7%
Met or exceeded writing standards: 62.9%
Met or exceeded science standards: 71.4%
Four year graduation rate: 84.4%

Prev
Next
#27
Mountain View Senior High
Bend-LaPine School District
Enrollment: 1283
Economically disadvantaged: 42%
Met or exceeded reading standards: 93.7%
Met or exceeded math standards: 82%
Met or exceeded writing standards: 75.2%
Met or exceeded science standards: 76.1%
Four year graduation rate: 78.3%
Photo Credit: Vince Kusters via Compfight cc

Prev
Next
#26
Tigard High
Tigard-Tualatin School District
Enrollment: 1835
Economically disadvantaged: 32%
Met or exceeded reading standards: 92.7%
Met or exceeded math standards: 83.5%
Met or exceeded writing standards: 64.5%
Met or exceeded science standards: 67.7%
Four year graduation rate: 80.8%
Prev
Next
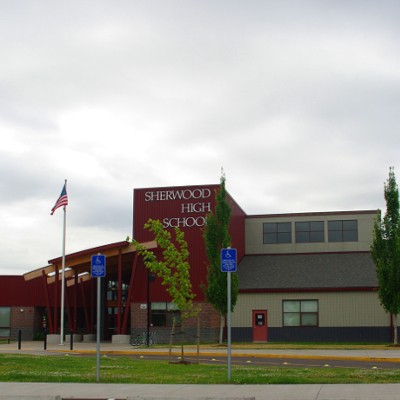
#25
Sherwood High
Sherwood School District
Enrollment: 1469
Economically disadvantaged: 15%
Met or exceeded reading standards: 97.5%
Met or exceeded math standards: 85.8%
Met or exceeded writing standards: 62.2%
Met or exceeded science standards: 84.8%
Four year graduation rate: 91.3%
Prev
Next
#24
Corvallis High
Corvallis School District
Enrollment: 1184
Economically disadvantaged: 32%
Met or exceeded reading standards: 87.5%
Met or exceeded math standards: 79.8%
Met or exceeded writing standards: 69.2%
Met or exceeded science standards: 76.4%
Four year graduation rate: 70.7%

Prev
Next
#23
Sprague High
Salem-Keizer School District
Enrollment: 1608
Economically disadvantaged: 32%
Met or exceeded reading standards: 97.5%
Met or exceeded math standards: 86.2%
Met or exceeded writing standards: 72.5%
Met or exceeded science standards: 79.6%
Four year graduation rate: 82.2%
Photo Credit: Jirka Matousek via Compfight cc
Prev
Next
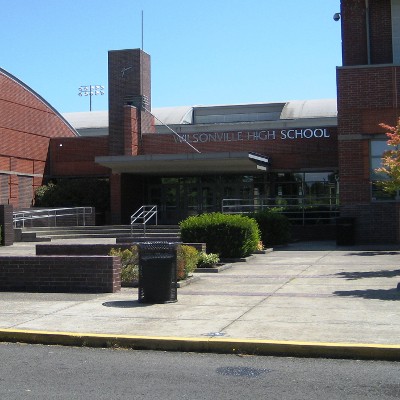
#22
Wilsonville High
West Linn-Wilsonville School District
Enrollment: 1093
Economically disadvantaged: 24%
Met or exceeded reading standards: 92.5%
Met or exceeded math standards: 74.1%
Met or exceeded writing standards: 74.2%
Met or exceeded science standards: 71.3%
Four year graduation rate: 85%

Prev
Next
#21
West Albany High
Greater Albany Public School District
Enrollment: 1317
Economically disadvantaged: 28%
Met or exceeded reading standards: 92.3%
Met or exceeded math standards: 87.5%
Met or exceeded writing standards: 75%
Met or exceeded science standards: 84.9%
Four year graduation rate: 93.6%
Photo Credit: jonas maaloe via Compfight cc

Prev
Next
#20
Clackamas High
North Clackamas School District
Enrollment: 2230
Economically disadvantaged: 29%
Met or exceeded reading standards: 91.7%
Met or exceeded math standards: 85.7%
Met or exceeded writing standards: 80.5%
Met or exceeded science standards: 74.2%
Four year graduation rate: 85.5%
Prev
Next
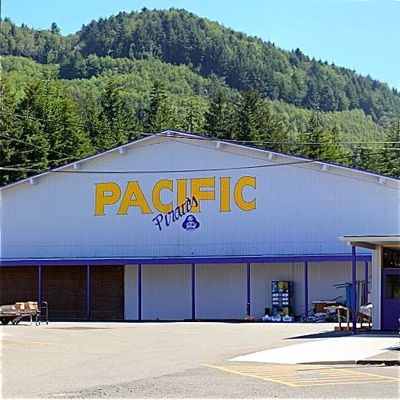
#19
Pacific High
Port Orford-Langlois School District
Enrollment: 90
Economically disadvantaged: 53%
Met or exceeded reading standards: 90.9%
Met or exceeded math standards: 59.1%
Met or exceeded writing standards: 77.3%
Met or exceeded science standards: 68.2%
Four year graduation rate: 78.3%
Photo Credit: Tedder - Own work. Licensed under CC BY 3.0 via Wikimedia Commons.
Prev
Next
#18
Southridge High
Beaverton School District
Enrollment: 1722
Economically disadvantaged: 27%
Met or exceeded reading standards: 91.5%
Met or exceeded math standards: 80.4%
Met or exceeded writing standards: 66.3%
Met or exceeded science standards: 68.9%
Four year graduation rate: 88.5%
Prev
Next
#17
Sisters High
Sisters School District
Enrollment: 480
Economically disadvantaged: 28%
Met or exceeded reading standards: 93.5%
Met or exceeded math standards: 74.1%
Met or exceeded writing standards: 77.8%
Met or exceeded science standards: 83.3%
Four year graduation rate: 88.4%

Prev
Next
#16
Glide High
Glide School District
Enrollment: 215
Economically disadvantaged: 45%
Met or exceeded reading standards: 97.5%
Met or exceeded math standards: 70.8%
Met or exceeded writing standards: 68.8%
Met or exceeded science standards: 93.8%
Four year graduation rate: 86.7%
Photo Credit: racka_abe via Compfight cc

Prev
Next
#15
Summit High
Bend-LaPine School District
Enrollment: 1344
Economically disadvantaged: 22%
Met or exceeded reading standards: 93.3%
Met or exceeded math standards: 74.6%
Met or exceeded writing standards: 73.6%
Met or exceeded science standards: 73.6%
Four year graduation rate: 88.3%
Photo Credit: frankjuarez via Compfight cc
Prev
Next
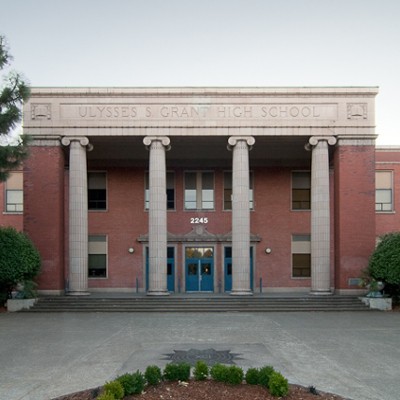
#14
Grant High
Portland School District
Enrollment: 1489
Economically disadvantaged: 24%
Met or exceeded reading standards: 92.6%
Met or exceeded math standards: 83.3%
Met or exceeded writing standards: 70.3%
Met or exceeded science standards: 66.4%
Four year graduation rate: 84.3%
Prev
Next
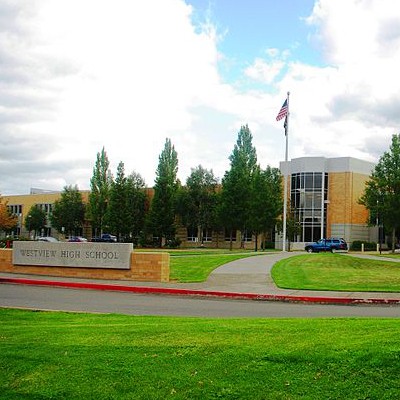
#13
Westview High
Beaverton School District
Enrollment: 2418
Economically disadvantaged: 33%
Met or exceeded reading standards: 92.2%
Met or exceeded math standards: 81.8%
Met or exceeded writing standards: 75.4%
Met or exceeded science standards: 70.3%
Four year graduation rate: 80.1%
Prev
Next
#12
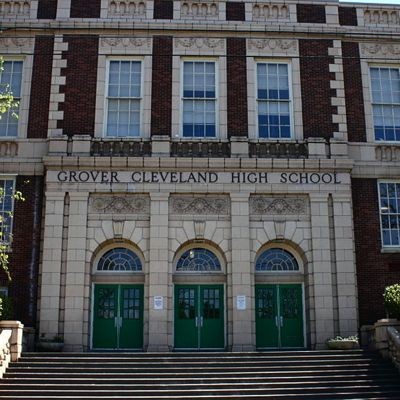
Cleveland High
Portland School District
Enrollment: 1457
Economically disadvantaged: 29%
Met or exceeded reading standards: 92.6%
Met or exceeded math standards: 80.2%
Met or exceeded writing standards: 81.4%
Met or exceeded science standards: 59.7%
Four year graduation rate: 76.2%
Tedder - Own work. Licensed under CC BY 3.0 via Wikimedia Commons.

Prev
Next
#11
Sunset High
Beaverton School District
Enrollment: 1942
Economically disadvantaged: 29%
Met or exceeded reading standards: 94.7%
Met or exceeded math standards: 83.3%
Met or exceeded writing standards: 76.8%
Met or exceeded science standards: 79.7%
Four year graduation rate: 81.4%

Prev
Next
#10
Wilson High
Portland School District
Enrollment: 1185
Economically disadvantaged: 22%
Met or exceeded reading standards: 91.8%
Met or exceeded math standards: 80.4%
Met or exceeded writing standards: 82.8%
Met or exceeded science standards: 63.8%
Four year graduation rate: 84.4%
Photo Credit: KristinNador via Compfight cc

Prev
Next
#9
Ashland High
Ashland School District
Enrollment: 940
Economically disadvantaged: 28%
Met or exceeded reading standards: 97.5%
Met or exceeded math standards: 85.8%
Met or exceeded writing standards: 79.8%
Met or exceeded science standards: 77.2%
Four year graduation rate: 86.1%
Prev
Next
#8
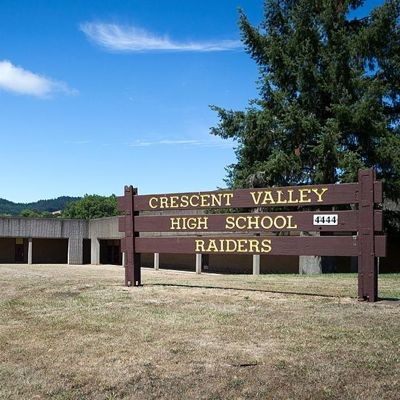
Crescent Valley High
Corvallis School District
Enrollment: 965
Economically disadvantaged: 23%
Met or exceeded reading standards: 97.5%
Met or exceeded math standards: 85.3%
Met or exceeded writing standards: 78.1%
Met or exceeded science standards: 77.8%
Four year graduation rate: 70.1%
Photo Credit: Visitor7 - Own work. Licensed under CC BY-SA 3.0 via Wikimedia Commons.

Prev
Next
#7
West Linn High
West Linn-Wilsonville School District
Enrollment: 1514
Economically disadvantaged: 10%
Met or exceeded reading standards: 97.5%
Met or exceeded math standards: 87.9%
Met or exceeded writing standards: 85.8%
Met or exceeded science standards: 83.2%
Four year graduation rate: 93.2%
Photo Credit: Tedder - Own work. Licensed under CC BY 3.0 via Wikimedia Commons.

Prev
Next
#6
Riverdale High
Riverdale School District
Enrollment: 242
Economically disadvantaged: <6%*
Met or exceeded reading standards: 97.5%
Met or exceeded math standards: 89.8%
Met or exceeded writing standards: 74.6%
Met or exceeded science standards: 74.6%
Four year graduation rate: 94.2%
*numbers less than 6% are represented by an asterisk in the Oregon Department of Education data.

Prev
Next
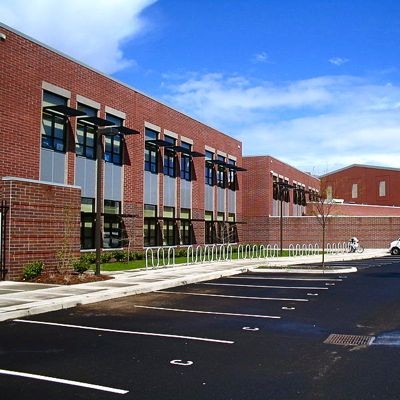
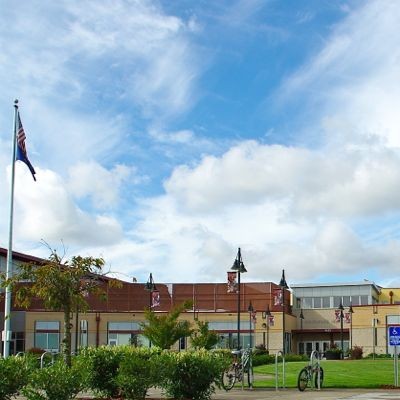
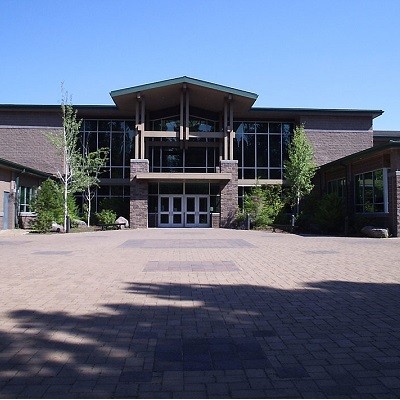
#5
School of Science & Technology
Beaverton School District
Enrollment: 167
Economically disadvantaged: 20%
Met or exceeded reading standards: 97.5%
Met or exceeded math standards: 97.5%
Met or exceeded writing standards: 86%
Met or exceeded science standards: 63.9%
Four year graduation rate: 81.1%
Photo Credit: Maya83 via Compfight cc
Prev
Next
#4
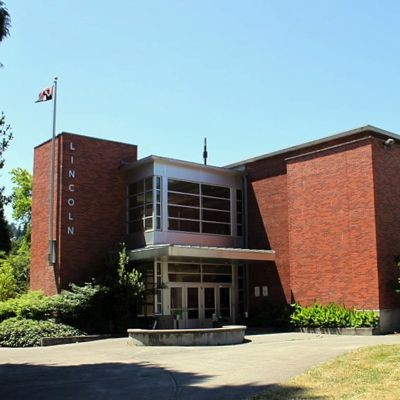
Lincoln High
Portland School District
Enrollment: 1471
Economically disadvantaged: 12%
Met or exceeded reading standards: 92.5%
Met or exceeded math standards: 85.3%
Met or exceeded writing standards: 88.1%
Met or exceeded science standards: 79.9%
Four year graduation rate: 89.3%
Photo Credit: Tedder - Own work. Licensed under CC BY 3.0 via Wikimedia Commons.
Prev
Next
#3
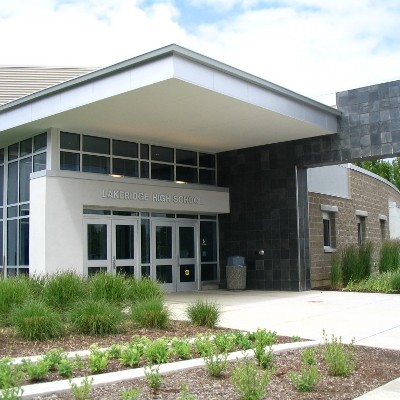
Lakeridge High
Lake Oswego School District
Enrollment: 1078
Economically disadvantaged: 8%
Met or exceeded reading standards: 97.5%
Met or exceeded math standards: 93.9%
Met or exceeded writing standards: 91.8%
Met or exceeded science standards: 92.1%
Four year graduation rate: 89.8%

Prev
Next
#2
South Eugene High
Eugene School District
Enrollment: 1321
Economically disadvantaged: 24%
Met or exceeded reading standards: 97.5%
Met or exceeded math standards: 91.6%
Met or exceeded writing standards: 84.9%
Met or exceeded science standards: 89.2%
Four year graduation rate: 79.4%
Photo Credit: katalicia1 via Compfight cc
Prev
Next
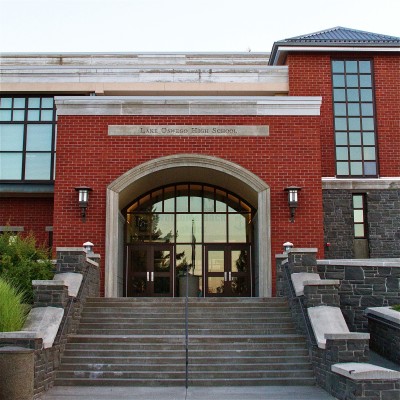
#1
Lake Oswego Senior High
Lake Oswego School District
Enrollment: 1224
Economically disadvantaged: 6%
Met or exceeded reading standards: 97.5%
Met or exceeded math standards: 92.4%
Met or exceeded writing standards: 89.1%
Met or exceeded science standards: 87.7%
Four year graduation rate: 89.5%
Photo Credit: KristinNador via Compfight cc
Related Articles
Enjoy this post? Share it with others.
Email to a friend
Permalink


_80_80_90_c1.JPG)


Follow us on Pinterest Google + Facebook Twitter See It Read It