Portland Then/Now: NE Martin Luther King Blvd. and Davis Street


Thursday, September 03, 2015
![NE Union Avenue [Martin Luther King Jr. Blvd] at NE Davis St.](/cache/images/cached/cache/images/remote/http_s3.amazonaws.com/art.golocalpdx.com/Lifestyle/1929_121-135-ne-union-mlk-blvd-at-ne-davis-looking-southwest_a2009-009-1767_2_360_360_90.jpg)
NE Union Avenue [Martin Luther King Jr. Blvd] at NE Davis Street, looking southwest, 1929: City of Portland Archive. A2009-009.1767
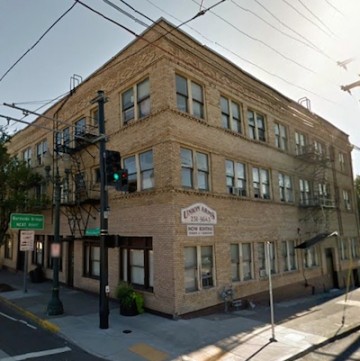
Martin Luther King Jr. Blvd at NE Davis Street, looking southwest
THEN: According to a comment on vintageportland.wordpress.com this photo “is almost certainly documenting the state of this building prior to the widening of Union Avenue (now MLK Blvd.).” The building, at the time this photo was taken in 1929, was home to a piano factory, an electrical repair shop and a former printer.
NOW: According to a post on vintageportland.wordpress.com “the building has undergone a remodel which increased the occupant load. The ground floor retail in what is now known as the Union Arms Apartments was removed and residential units added there. The brick facade was continued to the sidewalk and you can see a change of brick color in the current view. The main entrance was changed at that time from a rectangular corbeled brick opening to an arched opening…the apartments on the upper floors were sub-divided to make more studios and one bedrooms.”
A few blocks south of the Union Arms on MLK and East Burnside is The Yard. Located on the east end of the Burnside Bridge, according to Andersen Construction this 21-story, 334,000 square-foot mixed use includes residential, commercial and retail space. Andersen also says there will be 285 apartments located within 17 levels above four levels of above-grade parking along with 20,000 square feet of retail space.
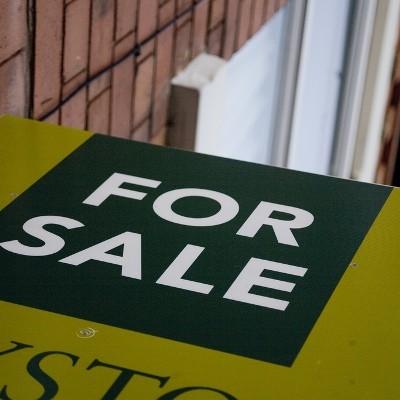
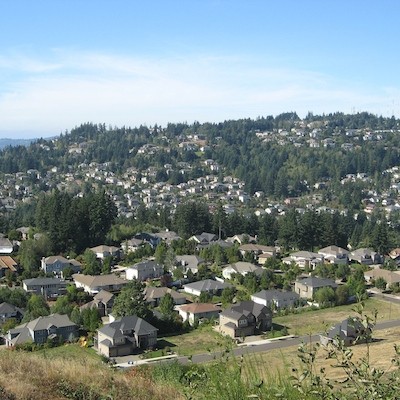
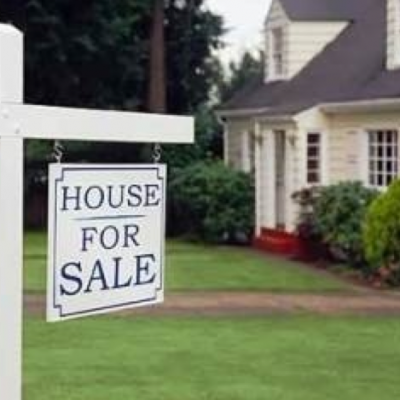
Related Slideshow: Portland’s 20 Hottest Neighborhoods for Real Estate
What are Portland’s hottest neighborhoods for real estate? The 20 neighborhoods below are ranked by the number of sold homes over the last 90 days. The information, along with the median list price and median price per square foot, comes from the real estate company Redfin. The population is from 2010 census data.
The sale to list percentage, also from Redfin, is the final selling price over what the listed price was, to show how close sellers came to their asking price. In cases where it is over 100 percent, the seller got more than then listed price.
Find out what the hottest real estate neighborhoods in Portland are:
_400_400_90.jpg)

#20 (tied)
#19 (tied)
#18 (tied)
#17
#16 (tied)
#15 (tied)
#14 (tied)_80_80_90_c1.jpg)
#13 (tied)
#12 (tied)
#11 (tied)
#10
#9
#8
#7
#6
#5
#4
#3
#2
#1
Related Articles
- Portland Then/Now: Southwest Fourth Avenue & Madison Street
- Portland Then/Now: Southwest Fourth Ave. & Yamhill St.
- Portland Then/Now: Southwest Fourth Avenue and Morrison Street
- Portland Then/Now: Southwest Park Ave. and Yamhill Street
- Portland Then/Now: Southwest Park Avenue & Taylor Street
- Portland Then/Now: Southwest Fifth Avenue
- Portland Then/Now: Southwest College Street & Sixth Avenue
- Portland Then/Now: Southwest Broadway and Alder Street
- Portland Then/Now: Southwest Broadway and Morrison Street
- Portland Then/Now: Southwest Broadway and Taylor Street
- Portland Then/Now: Southwest Broadway and Washington Street
- Portland Then/Now: Southwest Second Ave. & Burnside St.
- Portland Then/Now: Southwest Third and Clay Street
- Portland Then/Now: Union Station
- Portland Then/Now: Tom McCall Waterfront Park
- Portland Then/Now: West Burnside St. and Southwest 10th Ave.
- Portland Then/Now: West Burnside St. and Southwest 18th Ave.
- Portland Then/Now: West Burnside St. and SW Vista Ave.
- Portland Then/Now: The Portland Hotel/Pioneer Courthouse Square
- Portland Then/Now: The Corner of Southwest 11th Avenue & Morrison Street
- Portland Then/Now: Southwest Third Ave. and Burnside St.
- Portland Then/Now: SW Broadway and SW Taylor Street
- Portland Then/Now: SW Park Ave. & Yamhill & Taylor St.
- Portland Then/Now: SW Washington St. & Downtown Waterfront
- Portland Then/Now: Southwest 2nd Ave. and Yamhill Street
- Portland Then/Now: Southwest 12 Avenue & Alder Street
- Portland Then/Now: North Interstate Ave and Shaver Street
- Portland Then/Now: Multnomah County Central Library
- Portland Then/Now: North Lombard St. and Portsmouth Ave.
- Portland Then/Now: Northwest 12th Avenue and Lovejoy Street
- Portland Then/Now: Northwest Broadway and Everett Street
- Portland Then/Now: Morrison Bridge
- Portland Then/Now: Mill Ends Park
- Portland Then/Now: Broadway and North Larabee St.
- Portland Then/Now: Downtown Portland’s Keller Fountain Park
- Portland Then/Now: East Burnside and 8th Avenue
- Portland Then/Now: Hawthorne Bridge
- Portland Then/Now: Northwest Couch Street and Third Avenue
- Portland Then/Now: Northwest Third Ave. & West Burnside Street
- Portland Then/Now: South End of Burnside Bridge
- Portland Then/Now: South Park Blocks between SW Main & Salmon St.
- Portland Then/Now: Southwest 10th Ave. and Yamhill Street
- Portland Then/Now: Southwest 11th Ave. and Morrison St.
- Portland Then/Now: SE 82nd Ave. Between Clinton & Division
- Portland Then/Now: Sandy Blvd. & Northeast 24th Ave.
- Portland Then/Now: NW Couch St. & Second Ave.
- Portland Then/Now: Pioneer Courthouse Square
- Portland Then/Now: Portland City Hall
- Portland Then/Now: Portland State University & SW Park Ave.
- Portland Then/Now: Northwest Broadway Near Union Station


Follow us on Pinterest Google + Facebook Twitter See It Read It