How Oregon Communities are Fixing the Racial Gap in Political Leadership


Tuesday, July 21, 2015
Oregon’s State Commission on Hispanic Affairs lists Latinos who have served on the Legislature, one of which is current Rep. Sal Esquivel (R-Medford), who serves in an area that does not have a high Latino population. In contrast, Rep. Joseph Gallegos (D-Hillsboro) was elected in 2012 as the first Latino legislator from Washington County, which has about 16 percent Latinos. Another person of color, Sen. Jackie Winters (R-Salem), who was the first African American Republican, has been serving on the Legislature since she was elected in 1998. Rep. Jessica Vega Pederson (D-Portland), a Latina elected in 2012 to represent East Portland, was the majority Whip during the last session.
And the demographics are projected to continue to change, especially with a growing Latino population.
While, of course, this means that electoral demographics are changing with communities of color making up a margin of difference in an election, the missing factor is leadership from communities of color, says Joseph Santos-Lyons, executive director for Asian Pacific American Network of Oregon (APANO).
“One of our mantras is, ‘If you’re not at the table, you’re on the menu.’ People are actually making decisions about you and for you but not with you,” said Santos-Lyons.
“When it really comes to Oregon having a way for communities of color to be organized… there is a huge gap in this state,” he said, adding that Oregon is about one generation behind Washington state.
APANO has only had 501c3 status for five years, and there are only a small handful of organizations in Oregon that have a long historical presence and robust staffing and programs, he said.
Yet while engagement of communities of color has been weak, Santos-Lyons said that he’s seen a shift in the last five years or so. In particular, “The city of Portland and Multnomah County have made real conscious efforts to invest in communities of color,” said Santos-Lyons. “These decisions are putting Oregon back on track and creating an environment where we’re not going to have the kind of racially motivated hate crimes you’re going to see in other places.”
In the case of the city of Portland, the investments aren’t just creating more “token” multicultural dialogue, but actually making shifts in the way it structures and funds engagement. In 2007, the Office of Neighborhood Involvement began running the Diversity and Civic Leadership program that provided long-term funding for “communities beyond neighborhood boundaries.”
According to a January progress report on the program, at one time, the city tried to encourage diversity within its neighborhood associations, and it funded citizen engagement of communities of color for more than 20 years. But there was little success.
Shifting to a non-geographic model seems to have boosted participation.
Since 2007, the city has given grants to the Latino Network, Immigrant Refugee Community Organization, Native American Youth Family Center, Urban League of Portland and the Center for Intercultural Organizing to run the Diversity and Civic Leadership program.
“What makes this program unique is that the direction comes from the community and the trainings are culturally adapted to fit the group. It is really a ‘by the people for the people’ model,” said Jeri Williams, director of the Diversity and Civic Leadership program. “The success of the program lies in the self determination of the groups themselves to create their agendas and policies that are most relevant to their communities.”
The intent of the program is to create a pipeline of leadership through community organizations that extends to the city’s citizen advisory committees and eventually elected positions.
But it really starts with capacity first. “I think the challenging thing is getting people to understand the value to being engaged,” said Lakeitha Elliot, Urban League of Portland. “A lot of time people don’t know how to engage. It’s a little intimidating to let go and speak the truth to power… I think seeing people take their leadership to the next level is the most rewarding.”
Citizen engagement can be especially challenging when there’s a language barrier. The Latino Network used the leadership training to recruit Spanish-speaking residents to be involved in the Cully Park planning process. Now called Kʰunamokwst Park, after the Chinook word for “together,” it is the first city park to be named for the indigenous land where it is sited. It opened officially in May.
Multnomah County has taken steps to invest in culturally specific social services through partnerships with communities of color rather than using its general services model. For example, the Native American Rehabilitation Association provides addiction services within the context of American Indian and Alaskan Native spirituality.
Even grantmakers, notes Santos-Lyons, seems to be making a shift. In 2010, the Foundation Center for Grantmakers of Oregon and Southwest Washington authored a report finding a lack of investment in communities of color. In 2008, it estimated about 9.6 percent of funding given by Oregon foundations reached communities of color. The percent was higher for the five sources of Native American tribal funding, of which 13.2 percent reached communities of color (mostly Native American).
Foundations took note of this, said Santos-Lyons, specifically noting the work of the Oregon Community Foundation, who has a Latino Partnership Program that intends to deepen leadership development, education and build community.
“From where I sit, I just see this whole landscape shift of dollars being put into communities of color,” said Santos-Lyons.
Santos-Lyons, who sits on a number of national boards, said that people from around the country are “consistently impressed with the shift in attitudes and beliefs of our funders and grantmakers.”
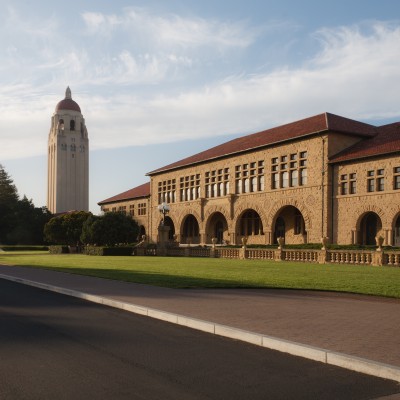
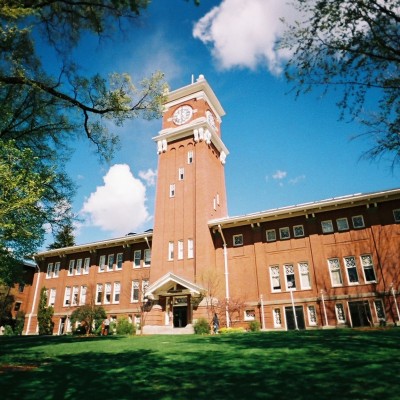
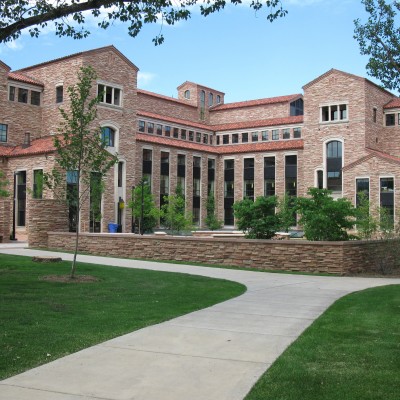
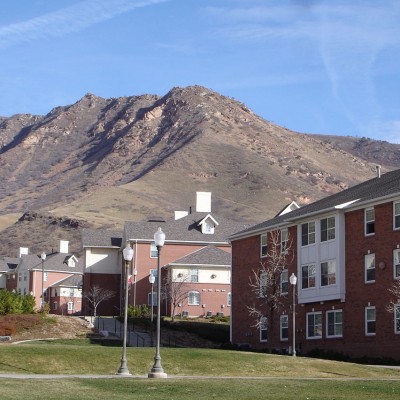
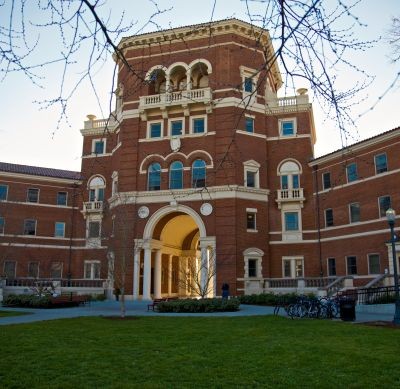
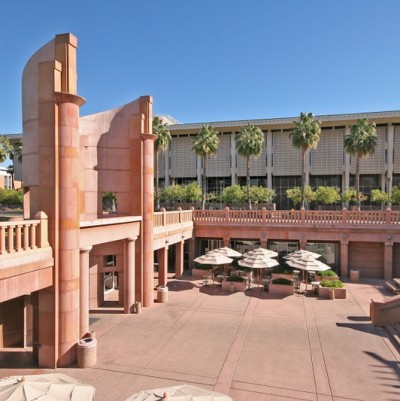
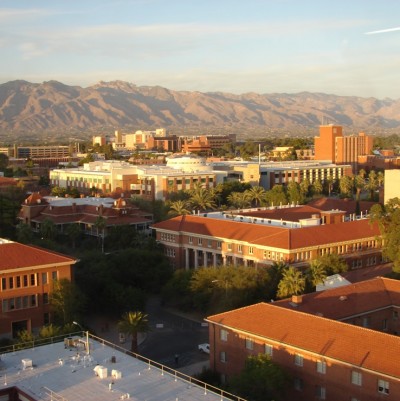
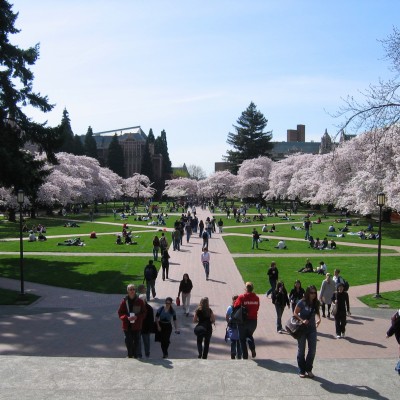
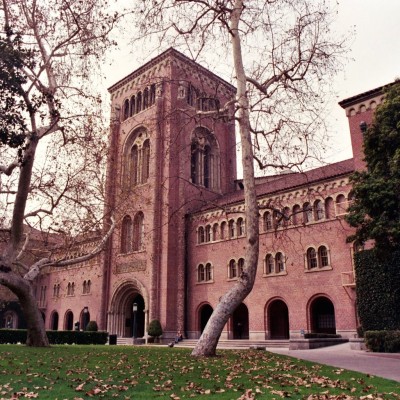
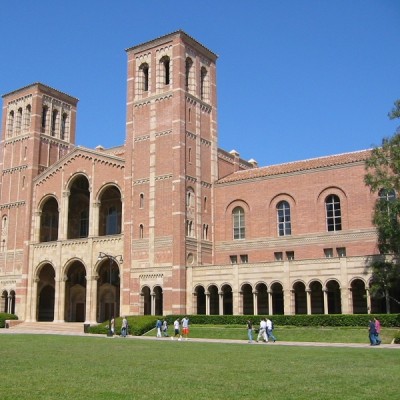
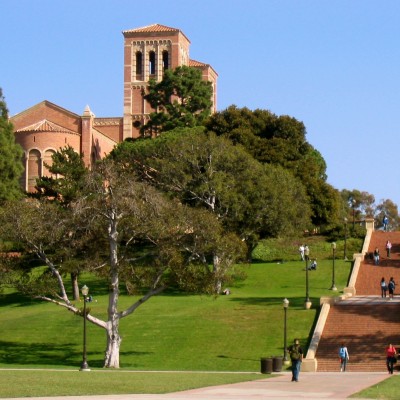
Related Slideshow: Ranking of Student Diversity in Pac-12 Schools
Rates of diversity among Pac-12 schools run the gamut between holding a hefty majority to scraping by with a slim minority. UCLA had a whopping 69.8%, compared to the University of Oregon's 20.9%. In fact, Univerity of Oregon ranked as the least diverse among the 12 schools in the conference. Using demographic data for the 2013-2014 school year provided by each university, GoLocalPDX sorted the schools by their rates of diversity within their student bodies. *University of Utah latest available data was from 2012-2013.
_-_5_400_400_90.jpg)
_-_5_80_80_90_c1.jpg)


Follow us on Pinterest Google + Facebook Twitter See It Read It