How Portland Schools Dropped the Ball on Effective Racial Justice Practices


 Email to a friend
Permalink
Email to a friend
Permalink
Thursday, July 09, 2015
Rebecca Randall, GoLocalPDX Contributor
For the 2014-2015 school year, the Rigler Elementary School community found themselves in limbo. After piloting successful restorative justice practices that effectively lowered disparity in suspension rates between black and white students, the district failed to support it, sending the school spiraling right back to where it was—at least in the eyes of the community.
When Kristie Lindholm first started as principal in 2007, Rigler Elementary School had a discipline problem that was a matter of racial justice. At the diverse, high-poverty neighborhood and English-Spanish dual immersion school in Northeast Portland, black students were being suspended at a rate of 6 to 1 white students. For Latino students, the ratio was between 2 and 3 to 1 white student, she said.
In 2010, the school received a grant from the Northwest Health Foundation to add a program meant to address the racial disparity. Restorative justice, embraced by many in the community, was no easy feat. But it worked.
The practice focuses on understanding what harms have been done and how to repair them rather using suspension.
“By the time the grant was done, we’d gotten (the ratio) to about 1 to 1,” said Lindholm.
But when it came down to getting district funding to continue providing the same level of service, the money wasn’t there. Lolenzo Poe, the chief equity officer at Portland Public Schools, said the staffing for restorative justice wasn’t done through his office. “When it is a school site position, (those decisions) are made by the building,” he said. “They determine what and how they use those positions.”
That doesn’t change the fact that those in Rigler’s community feel that the burden of supporting the program should be on the district.
“I talked to (a district administrator) and said, ‘How are we going to support Rigler?’ She said, ‘Well, we’ve been supporting them for three years. They should be ready to fly on their own,’” said Tobin Krell, who held the restorative justice specialist position at Rigler.
Lindholm explained that after the grant ended, she was able to find funding for one more year, but in what would have been the fifth year—2014-2015—she just couldn’t keep it going. “The district should fund schools based on their need rather than a particular formula,” she said.
Lindholm speculated that the reason she was moved to a new school was because she was too noisy about the issue, though she said she was also very stressed out. “The seven hardest years of my life blew up. It was hard to watch because I felt like we’d made so much progress, and really we were on the right track. And then it just wasn’t supported,” said Lindholm. “What is our commitment to restorative justice and equity work if we’re not willing to pay for it?”
Ironically, Rigler’s year without restorative justice was also the first year that the district prioritized reducing inequality in discipline as a top goal. The district’s goal is to cut discipline by suspension in half and close the gap between students of color and white by half, ensuring that students don’t miss out on instruction.
So why neglect to fund a program that was on track to achieve that goal?
Well, it’s complicated.
“We lost Kristie, Tobin and a large group of teachers all in one year, so the institutional memory for restorative justice went with it, too,” said Jesse Chapman, president of the Parent Teacher Association at Rigler.
The next principal Sara Gandarilla eventually left mid-year taking a medical leave after teachers complained to the district. Gandarilla asked the district for funding for the restorative justice position several times but was turned down. "I tried really hard to continue the program because I completely believe in restorative justice," she said.
Poe acknowledged that unfortunately the program at Rigler “slipped,” but that this fall the district had included funding to support restorative justice at Rigler and schools district-wide.
The suspension problem at Rigler is not a singular case, after all. Across the district, students of color are far more likely to experience expulsion than white students. In 2013-2014 African American students were about 4.6 times as likely to be suspended than a white student; 10.5 percent of African American students were expelled at least once. Meanwhile, 7.4 percent of Native Americans, 4.4 percent of Pacific Islanders, 3.9 percent of Hispanics, 3.8 of percent mixed race, 2.3 percent of whites and 1 percent of Asians were expelled.
In the last few years, the number of students being suspended has decreased district-wide, but the disparity in expulsion for students of color remains. Lindholm wondered why the Rigler success hasn’t been given more credit, since it did reduce the disparity.
Yet, Poe said the district will look at incorporating restorative justice with other behavior practices rather than use the same model that Rigler had. Instead, there will be a restorative justice coordinator at the central office who will do training throughout the district. Whether individual schools choose to pursue specialist positions is up to them. However, this is the widest roll-out of restorative justice in Portland schools.
But the district may still have skeptics.
“They want to keep pushing it as a program, but they don’t want to own it; they don’t want to internalize it,” said Krell.
Lindholm said the district has been supportive and willing to give the program lip service but seems to be looking for a “quick fix.”
While Rigler’s story proves that success is attainable given time and hard work, it also illustrates that lasting gains take continued investment.
To make restorative justice work, Lindholm had to get teachers to buy into the practice. “I think when I had gotten there originally, there were teachers that just weren’t dealing with it. Kids of color were sent out of class for ELL, special ed…” she said.
She presented the vision she had to staff and told them that if they didn’t want to “get on the bus” that she’d help them find new assignments. She lost about 20 teachers. Those that stayed grew weary. “As kids came in and we had all of these restorative practices and ideas, it didn’t necessarily change overnight, so teachers still had kids come in with all these crazy behaviors,” said Lindholm. “(Teachers) didn’t know how we were going to get there. They didn’t know how we were going to bridge this gap.”
But it didn’t stop there; the program needed to engage parents, as well as kids, trying to build a new kind of community.
Chapman was accustomed to school being about learning how to read and do math, “‘but if you don’t know how to behave in a group situation then get out of my classroom,’” he characterized the attitude of teachers. “At Rigler… if you don’t know how to behave, ‘we’ll teach you.’”
Laura Peraza, speaking in Spanish through a translator, said the program is not just for the kids, but for the parents, who fight amongst each other as well: “I really think it’s important that there be someone to be there to help us with the disciple not just for the kids but for the parents as well.”
In fact, some meetings were just for parents to “hash it all out,” said Madonna Miller, who has had two children at Rigler for five years. One year, two girls were bullying the whole second grade, she said. Krell arranged a meeting for parents, which was quite tense, but in the end, the bullying lessened and ultimately it brought parents together and helped them feel comfortable to talk about the problem, Miller said. “That’s what restorative justice is to me.”
Miller’s son, who has ADHD, also benefited from the program, which helped keep him in the classroom rather than excluding him due to his behavior. She explained that he wanted to be sent home, but with restorative justice, he wasn’t allowed to get out of class.
Since the program fizzled, the worst part for Jacqueline Hale, whose fifth-grade daughter has been at Rigler since kindergarten, has been the lack of resolution. Last year, her daughter was choked up against a wall by another child, she said, but since the district is still trying to cut down on expulsions, she’s not sure whether the child was punished. Hale said it made her feel like the administration just didn’t care. “That upset me, too, because what if something could have happened to my child?” said Hale.
Last week, the parents, who are feeling abandoned by the school district, gathered to talk in a “healing circle,” just like they learned to do using restorative justice practices.
At the beginning, Krell asked all the participants what word came to mind when they heard the word “education.” Each took a turn.
“Frustration.”
“Anger.”
“Complicated.”
Yet for Krell, the word comes to mind when he thinks of education?
“Hope.”
Maybe there is. “It takes time to change culture. You have to be time sensitive, but not trying to rush a culture change because we want to be sure that it takes,” said Poe, who judges it will take a number of years before the district can see success.
EDITOR’S NOTE: An earlier version of this article reported that Sara Gandarilla refused extra funding from the school district to fund a restorative justice specialist. She asked the district several times for funding and was turned down.
We apologize for this error and have updated the story.
Related Slideshow: Top 100 Oregon High Schools
GoLocalPDX has ranked high schools across the state based on a method developed at Babson College, Mass. See below for the top 100 schools in the Beaver State.

Prev
Next
#100
South Albany High School
Greater Albany Public School District
Enrollment: 1260
Economically disadvantaged: 55%
Met or exceeded reading standards: 86.9%
Met or exceeded math standards: 65.5%
Met or exceeded writing standards: 68.1%
Met or exceeded science standards: 54.6%
Four year graduation rate: 76.2%
Photo Credit: kamera kızı via Compfight cc

Prev
Next
#99
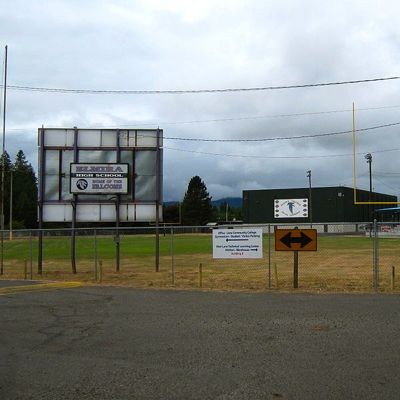
Yamhill Carlton High
Yamhill Carlton School District
Enrollment: 375
Economically disadvantaged: 32%
Met or exceeded reading standards: 93.8%
Met or exceeded math standards: 60.8%
Met or exceeded writing standards: 47.9%
Met or exceeded science standards: 69.6%
Four year graduation rate: 83.8%
Prev
Next
#98
Phoenix High
Phoenix-Talent School District
Enrollment: 695
Economically disadvantaged: 54%
Met or exceeded reading standards: 88.3%
Met or exceeded math standards: 74.7%
Met or exceeded writing standards: 64%
Met or exceeded science standards: 56.4%
Four year graduation rate: 70.6%
Prev
Next
#97
Benson Polytechnic High
Portland School District
Enrollment: 819
Economically disadvantaged: 68%
Met or exceeded reading standards: 87.1%
Met or exceeded math standards: 75.9%
Met or exceeded writing standards: 40.8%
Met or exceeded science standards: 84%
Four year graduation rate: 82.2%
Prev
Next
#96
North Marion High
North Marion School District
Enrollment: 588
Economically disadvantaged: 62%
Met or exceeded reading standards: 86.3%
Met or exceeded math standards: 64.9%
Met or exceeded writing standards: 58.6%
Met or exceeded science standards: 58.5%
Four year graduation rate: 87.6%

Prev
Next
#95
Hidden Valley High
Three Rivers/Josephine County School District
Enrollment: 681
Economically disadvantaged: 53%
Met or exceeded reading standards: 83.7%
Met or exceeded math standards: 71.4%
Met or exceeded writing standards: 52.2%
Met or exceeded science standards: 66.7%
Four year graduation rate: 68.3%
Photo Credit: dcJohn via Compfight cc
Photo Credit: sleepyneko via Compfight cc

Prev
Next
#94
North Valley High
Three Rivers/Josephine County School District
Enrollment: 522
Economically disadvantaged: 51%
Met or exceeded reading standards: 89.2
Met or exceeded math standards: 56%
Met or exceeded writing standards: 46.8%
Met or exceeded science standards: 72.2%
Four year graduation rate: 68.3%
Photo Credit: naosuke ii via Compfight cc
Photo Credit: peteoshea via Compfight cc

Prev
Next
#93
Stayton High
North Santiam School District
Enrollment: 749
Economically disadvantaged: 48%
Met or exceeded reading standards: 85.3%
Met or exceeded math standards: 68.9%
Met or exceeded writing standards: 56.8%
Met or exceeded science standards: 70.6%
Four year graduation rate: 70.1%
Photo Credit: katerha via Compfight cc
Prev
Next
#92
Liberty High
Hillsboro School District
Enrollment: 1386
Economically disadvantaged: 46%
Met or exceeded reading standards: 89.8%
Met or exceeded math standards: 76%
Met or exceeded writing standards: 53.3%
Met or exceeded science standards: 65.8%
Four year graduation rate: 79.6%
Photo Credit: Aboutmovies, CC

Prev
Next
#91
Academy of Arts and Academics
Springfield School District
Enrollment: 280
Economically disadvantaged: 49%
Met or exceeded reading standards: 90.7%
Met or exceeded math standards: 57.4%
Met or exceeded writing standards: 65.4%
Met or exceeded science standards: 73.6%
Four year graduation rate: 84.1%
Prev
Next
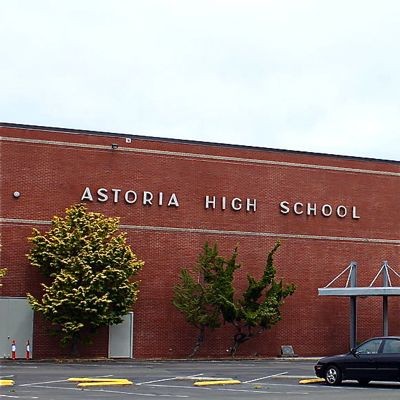
#90
Astoria Senior High
Astoria School District
Enrollment: 572
Economically disadvantaged: 48%
Met or exceeded reading standards: 93.1%
Met or exceeded math standards: 73.8%
Met or exceeded writing standards: 74.3%
Met or exceeded science standards: 52.7%
Four year graduation rate: 59.9%

Prev
Next
#89
Crane Union high School
Harney County Union High School District
Enrollment: 69
Economically disadvantaged: 39%
Met or exceeded reading standards: 97.5%
Met or exceeded math standards: 97.5%
Met or exceeded writing standards: 52.2%
Met or exceeded science standards: 69.6%
Four year graduation rate: 95%

Prev
Next
#88
Vale High
Vale School District
Enrollment: 234
Economically disadvantaged: 52%
Met or exceeded reading standards: 84.6%
Met or exceeded math standards: 64.6%
Met or exceeded writing standards: 63.1%
Met or exceeded science standards: 81.5%
Four year graduation rate: 88.2%

Prev
Next
#87
Gold Beach High
Central Curry School District
Enrollment: 173
Economically disadvantaged: 57%
Met or exceeded reading standards: 91.9%
Met or exceeded math standards: 81.1%
Met or exceeded writing standards: 62.2%
Met or exceeded science standards: 80.8%
Four year graduation rate: 56.7%
Photo Credit: Google
Prev
Next
#86
Dallas High
Dallas School District
Enrollment: 979
Economically disadvantaged: 35%
Met or exceeded reading standards: 84.4%
Met or exceeded math standards: 72.8%
Met or exceeded writing standards: 49%
Met or exceeded science standards: 69.8%
Four year graduation rate: 52.9%
Photo Credit: Tedder - Own work. Licensed under CC BY 3.0 via Wikimedia Commons.
Prev
Next
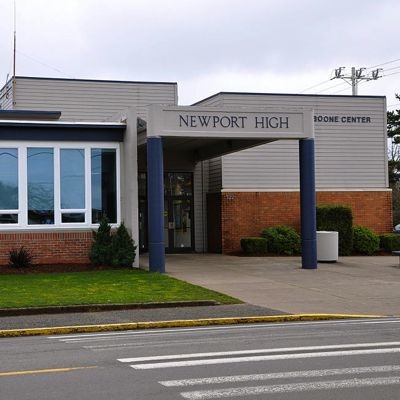
#85
Newport High School
Lincoln County School District
Enrollment: 528
Economically disadvantaged: 43%
Met or exceeded reading standards: 91.7%
Met or exceeded math standards: 81.7%
Met or exceeded writing standards: 62.6%
Met or exceeded science standards: 57.8%
Four year graduation rate: 70.7%
Photo Credit: Finetooth - Own work. Licensed under CC BY-SA 3.0 via Wikimedia Commons.
Prev
Next
#84
LaPine Senior High
Bend-LaPine School District
Enrollment: 439
Economically disadvantaged: 63%
Met or exceeded reading standards: 88.9%
Met or exceeded math standards: 72.4%
Met or exceeded writing standards: 47.5%
Met or exceeded science standards: 62.2%
Four year graduation rate: 74.7%
Photo Credit: samantha celera via Compfight cc

Prev
Next
#83
Aloha High
Beaverton School District
Enrollment: 1962
Economically disadvantaged: 61%
Met or exceeded reading standards: 82.7%
Met or exceeded math standards: 64.5%
Met or exceeded writing standards: 62.2%
Met or exceeded science standards: 60.2%
Four year graduation rate: 72.7%

Prev
Next
#82
La Grande High
La Grande School District
Enrollment: 560
Economically disadvantaged: 37%
Met or exceeded reading standards: 84.3%
Met or exceeded math standards: 60%
Met or exceeded writing standards: 56.4%
Met or exceeded science standards: 59.4%
Four year graduation rate: 74.1%
Photo Credit: Fiorenza Thompson via Compfight cc
Prev
Next
#81
Yoncalla High
Yoncalla School District
Enrollment: 87
Economically disadvantaged: 70%
Met or exceeded reading standards: 97.5%
Met or exceeded math standards: 58.8%
Met or exceeded writing standards: 64.7%
Met or exceeded science standards: 52.9%
Four year graduation rate: 78.8%
Visitor7 - Own work. Licensed under CC BY-SA 3.0 via Wikimedia Commons.
Prev
Next
#80
Elmira High
Fern Ridge School District
Enrollment: 436
Economically disadvantaged: 52%
Met or exceeded reading standards: 88.7%
Met or exceeded math standards: 70.1%
Met or exceeded writing standards: 63.5%
Met or exceeded science standards: 66.7%
Four year graduation rate: 77.6%
Photo Credit: Katr67 - Own work. Licensed under Public domain via Wikimedia Commons.
Prev
Next
#79
Churchill High
Eugene School District
Enrollment: 1020
Economically disadvantaged: 44%
Met or exceeded reading standards: 82.5%
Met or exceeded math standards: 73.6%
Met or exceeded writing standards: 68.8%
Met or exceeded science standards: 61.3%
Four year graduation rate: 69.2%
Photo Credit: EvelynGiggles via Compfight cc
Prev
Next
#78
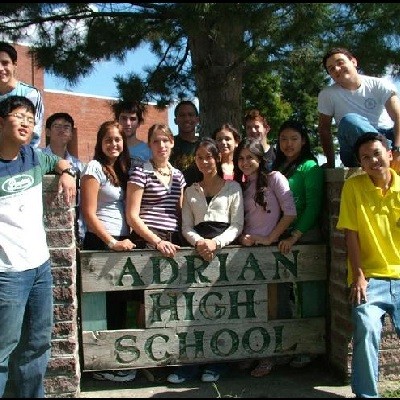
Adrian High
Adrian School District
Enrollment: 64
Economically disadvantaged: 55%
Met or exceeded reading standards: 97.5%
Met or exceeded math standards: 57.1%
Met or exceeded writing standards: 71.4%
Met or exceeded science standards: 57.1%
Four year graduation rate: 95.5%
Prev
Next
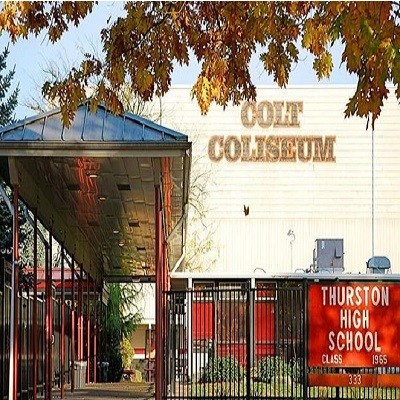
#77
Thurston High
Springfield School District
Enrollment: 1387
Economically disadvantaged: 42%
Met or exceeded reading standards: 85%
Met or exceeded math standards: 68.8%
Met or exceeded writing standards: 73.4%
Met or exceeded science standards: 57.6%
Four year graduation rate: 74.9%

Prev
Next
#76
North Medford High
Medford School District
Enrollment: 1612
Economically disadvantaged: 50%
Met or exceeded reading standards: 89.6%
Met or exceeded math standards: 74.6%
Met or exceeded writing standards: 55.1%
Met or exceeded science standards: 73.9%
Four year graduation rate: 68%
Photo Credit: theilr via Compfight cc

Prev
Next
#75
Klamath Union High
Klamath Falls City School District
Enrollment: 663
Economically disadvantaged: 56%
Met or exceeded reading standards: 81.9%
Met or exceeded math standards: 69.5%
Met or exceeded writing standards: 40.2%
Met or exceeded science standards: 54.8%
Four year graduation rate: 83.4%
Photo Credit: User:bobjgalindo - Own work. Licensed under CC BY-SA 3.0 via Wikimedia Commons.

Prev
Next
#74
Sandy High
Oregon Trail School District
Enrollment: 1286
Economically disadvantaged: 36%
Met or exceeded reading standards: 86.4%
Met or exceeded math standards: 69%
Met or exceeded writing standards: 59%
Met or exceeded science standards: 71.6%
Four year graduation rate: 76%

Prev
Next
#73
Henley High
Klamath County School District
Enrollment: 608
Economically disadvantaged: 33%
Met or exceeded reading standards: 86.7%
Met or exceeded math standards: 74.7%
Met or exceeded writing standards: 54.7%
Met or exceeded science standards: 64.7%
Four year graduation rate: 84.9%

Prev
Next
#72
Pendleton High
Pendleton School District
Enrollment: 881
Economically disadvantaged: 43%
Met or exceeded reading standards: 88.8%
Met or exceeded math standards: 82.7%
Met or exceeded writing standards: 49.7%
Met or exceeded science standards: 61.2%
Four year graduation rate: 75.5%
Prev
Next
#71
Cottage Grove High
South Lane School District
Enrollment: 761
Economically disadvantaged: 59%
Met or exceeded reading standards: 90.4%
Met or exceeded math standards: 70.9%
Met or exceeded writing standards: 54.6%
Met or exceeded science standards: 64%
Four year graduation rate: 87.6%
Photo Credit: Visitor7 - Own work. Licensed under CC BY-SA 3.0 via Wikimedia Commons.
Prev
Next
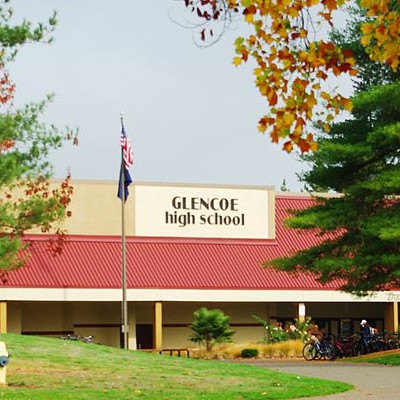
#70
Glencoe High
Hillsboro School District
Enrollment: 1601
Economically disadvantaged: 39%
Met or exceeded reading standards: 88.3%
Met or exceeded math standards: 70.5%
Met or exceeded writing standards: 58.4%
Met or exceeded science standards: 69.9%
Four year graduation rate: 77.1%
Prev
Next
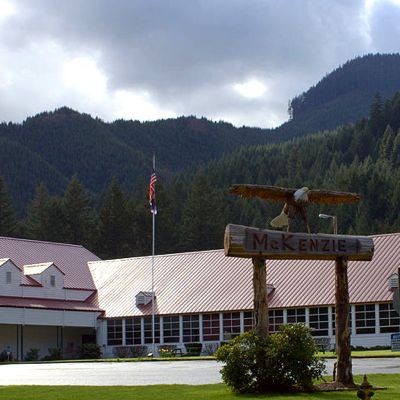
#69
McKenzie High
McKenzie School District
Enrollment: 67
Economically disadvantaged: 61%
Met or exceeded reading standards: 91.7%
Met or exceeded math standards: 41.7%
Met or exceeded writing standards: 50%
Met or exceeded science standards: 83.3%
Four year graduation rate: 68%
Photo Credit: Tedder - Own work. Licensed under CC BY 3.0 via Wikimedia Commons.

Prev
Next
#68
St. Helens High
St. Helens School District
Enrollment: 974
Economically disadvantaged: 36%
Met or exceeded reading standards: 91.4%
Met or exceeded math standards: 72.4%
Met or exceeded writing standards: 59.2%
Met or exceeded science standards: 66%
Four year graduation rate: 75.7%
Photo Credit: M.O. Stevens - Own work. Licensed under CC BY-SA 3.0 via Wikimedia Commons.
Prev
Next
#67
Lakeview Senior High
Lake County School District
Enrollment: 223
Economically disadvantaged: 45%
Met or exceeded reading standards: 87.8%
Met or exceeded math standards: 69.4%
Met or exceeded writing standards: 66.7%
Met or exceeded science standards: 73.5%
Four year graduation rate: 88.1%
Prev
Next
#66
McNary High
Salem-Keizer School District
Enrollment: 1924
Economically disadvantaged: 49%
Met or exceeded reading standards: 89.8%
Met or exceeded math standards: 75%
Met or exceeded writing standards: 59.5%
Met or exceeded science standards: 66.1%
Four year graduation rate: 82%

Prev
Next
#65
Banks High
Banks School District
Enrollment: 384
Economically disadvantaged: 23%
Met or exceeded reading standards: 91.5%
Met or exceeded math standards: 79.8%
Met or exceeded writing standards: 57.4%
Met or exceeded science standards: 81.1%
Four year graduation rate: 80.6%
Photo Credit: valakirka via Compfight cc

Prev
Next
#64
Clackamas Middle College
North Clackamas School District
Enrollment: 290
Economically disadvantaged: 28%
Met or exceeded reading standards: 91.4%
Met or exceeded math standards: 76.3%
Met or exceeded writing standards: 59.3%
Met or exceeded science standards: 78%
Four year graduation rate: 32.6%
Photo Credit: slightly everything via Compfight cc

Prev
Next
#63
South Medford High
Medford School District
Enrollment: 1698
Economically disadvantaged: 56%
Met or exceeded reading standards: 87.9%
Met or exceeded math standards: 76.8%
Met or exceeded writing standards: 61.7%
Met or exceeded science standards: 71.2%
Four year graduation rate: 80.4%
Photo Credit: @RunRockPrincess via Compfight cc
Prev
Next
#62
McMinnville High
McMinnville School District
Enrollment: 1864
Economically disadvantaged: 48%
Met or exceeded reading standards: 91.1%
Met or exceeded math standards: 73.3%
Met or exceeded writing standards: 66%
Met or exceeded science standards: 64.6%
Four year graduation rate: 77.1%
Prev
Next
#61
Estacada High
Estacada School District
Enrollment: 589
Economically disadvantaged: 46%
Met or exceeded reading standards: 89.9%
Met or exceeded math standards: 77.7%
Met or exceeded writing standards: 59%
Met or exceeded science standards: 66.4%
Four year graduation rate: 71.8%

Prev
Next
#60
Philomath High
Philomath School District
Enrollment: 519
Economically disadvantaged: 29%
Met or exceeded reading standards: 82.8%
Met or exceeded math standards: 75%
Met or exceeded writing standards: 56.3%
Met or exceeded science standards: 69.5%
Four year graduation rate: 75%

Prev
Next
#59
Weston-McEwen High
Athena-Weston School District
Enrollment: 164
Economically disadvantaged: 33%
Met or exceeded reading standards: 97.5%
Met or exceeded math standards: 61.1%
Met or exceeded writing standards: 76.5%
Met or exceeded science standards: 47.2%
Four year graduation rate: 75.7%
Prev
Next
#58
Grants Pass High
Grants Pass School District
Enrollment: 1734
Economically disadvantaged: 55%
Met or exceeded reading standards: 90.3%
Met or exceeded math standards: 68.8%
Met or exceeded writing standards: 68.3%
Met or exceeded science standards: 72.3%
Four year graduation rate: 69%

Prev
Next
#57
North Eugene High
Eugene School District
Enrollment: 927
Economically disadvantaged: 54%
Met or exceeded reading standards: 88.1%
Met or exceeded math standards: 71.2%
Met or exceeded writing standards: 68.3%
Met or exceeded science standards: 63%
Four year graduation rate: 70.7%
Prev
Next
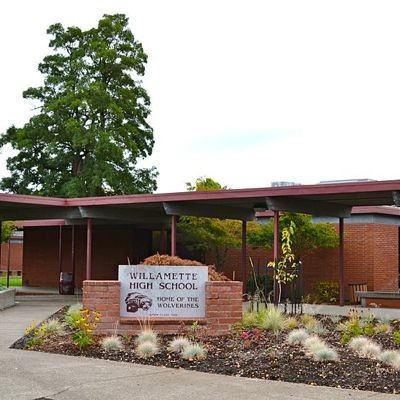
#56
Willamette High
Bethel School District
Enrollment: 1452
Economically disadvantaged: 48%
Met or exceeded reading standards: 89.6%
Met or exceeded math standards: 69.5%
Met or exceeded writing standards: 77.1%
Met or exceeded science standards: 68.2%
Four year graduation rate: 73%
Prev
Next
#55
Putnam High
North Clackamas School District
Enrollment: 1196
Economically disadvantaged: 39%
Met or exceeded reading standards: 88.6%
Met or exceeded math standards: 73.4%
Met or exceeded writing standards: 69.9%
Met or exceeded science standards: 59.3%
Four year graduation rate: 75.7%

Prev
Next
#54
Neah-Kah-Nie High
Neah-Kah Nie School District
Enrollment: 181
Economically disadvantaged: 54%
Met or exceeded reading standards: 83.7%
Met or exceeded math standards: 58.5%
Met or exceeded writing standards: 41.9%
Met or exceeded science standards: 97.5%
Four year graduation rate: 87.5%
Photo Credit: albertogp123 via Compfight cc
Prev
Next
#53
Scappoose High
Scappoose School District
Enrollment: 692
Economically disadvantaged: 28%
Met or exceeded reading standards: 89.6%
Met or exceeded math standards: 85.2%
Met or exceeded writing standards: 54.6%
Met or exceeded science standards: 84.4%
Four year graduation rate: 80.6%
Prev
Next
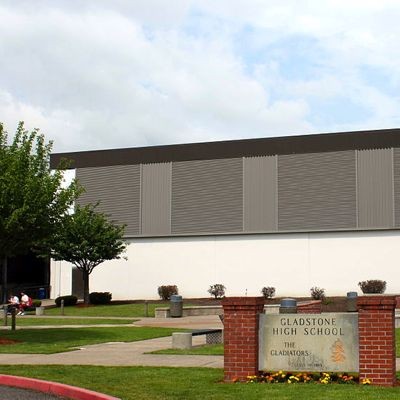
#52
Gladstone High
Gladstone School District
Enrollment: 677
Economically disadvantaged: 40%
Met or exceeded reading standards: 88.7%
Met or exceeded math standards: 77.5%
Met or exceeded writing standards: 66%
Met or exceeded science standards: 82.2%
Four year graduation rate: 78.9%
Prev
Next
#51
Franklin High
Portland School District
Enrollment: 1387
Economically disadvantaged: 56%
Met or exceeded reading standards: 89.2%
Met or exceeded math standards: 77.7%
Met or exceeded writing standards: 68.1%
Met or exceeded science standards: 59.8%
Four year graduation rate: 78.4%
Prev
Next
#50
Seaside High
Seaside High School
Enrollment: 453
Economically disadvantaged: 52%
Met or exceeded reading standards: 91.2%
Met or exceeded math standards: 70.3%
Met or exceeded writing standards: 60.8%
Met or exceeded science standards: 65.3%
Four year graduation rate: 69.5%

Prev
Next
#49
Siuslaw High
Siuslaw School District
Enrollment: 409
Economically disadvantaged: 53%
Met or exceeded reading standards: 89.4%
Met or exceeded math standards: 65.1
Met or exceeded writing standards: 73.3%
Met or exceeded science standards: 77.1%
Four year graduation rate: 65.9%
_400_400_90.JPG)
Prev
Next
#48
Century High
Hillsboro School District
Enrollment: 1608
Economically disadvantaged: 43%
Met or exceeded reading standards: 87.8
Met or exceeded math standards: 78.6%
Met or exceeded writing standards: 62.7%
Met or exceeded science standards: 72.9%
Four year graduation rate: 84.8%

Prev
Next
#47
Junction City High
Junction City School District
Enrollment: 532
Economically disadvantaged: 54%
Met or exceeded reading standards: 85.6%
Met or exceeded math standards: 76.8%
Met or exceeded writing standards: 56.8%
Met or exceeded science standards: 64.8%
Four year graduation rate: 65.1%
Photo Credit: crazytales562 via Compfight cc
Prev
Next
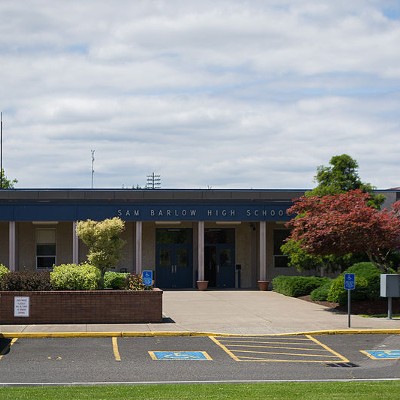
#46
Sam Barlow High
Gresham-Barlow School District
Enrollment: 1651
Economically disadvantaged: 38%
Met or exceeded reading standards: 84.5%
Met or exceeded math standards: 78.4%
Met or exceeded writing standards: 68.8%
Met or exceeded science standards: 76.7%
Four year graduation rate: 81.8%
Prev
Next
#45
Forest Grove High
Forrest Grove School District
Enrollment: 1779
Economically disadvantaged: 59%
Met or exceeded reading standards: 89.4%
Met or exceeded math standards: 85.7%
Met or exceeded writing standards: 66.6%
Met or exceeded science standards: 61.1%
Four year graduation rate: 72.5%
Prev
Next
#44
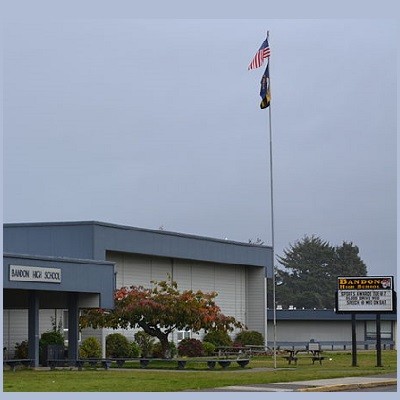
Bandon Senior High
Bandon School District
Enrollment: 242
Economically disadvantaged: 60%
Met or exceeded reading standards: 86.1%
Met or exceeded math standards: 68.1%
Met or exceeded writing standards: 56.3%
Met or exceeded science standards: 70.4%
Four year graduation rate: 72.9%

Prev
Next
#43
South Salem High
Salem-Keizer School District
Enrollment: 1835
Economically disadvantaged: 49%
Met or exceeded reading standards: 89.5%
Met or exceeded math standards: 73.3%
Met or exceeded writing standards: 66.2%
Met or exceeded science standards: 66.5%
Four year graduation rate: 81.9%

Prev
Next
#42
Hood River Valley High
Hood River County School District
Enrollment: 1218
Economically disadvantaged: 57%
Met or exceeded reading standards: 87.1%
Met or exceeded math standards: 78.5%
Met or exceeded writing standards: 69.7%
Met or exceeded science standards: 53.5%
Four year graduation rate: 77.4%

Prev
Next
#41
North Douglas High
North Doughlas School District
Enrollment: 98
Economically disadvantaged: 45%
Met or exceeded reading standards: 91.3%
Met or exceeded math standards: 78.3%
Met or exceeded writing standards: 72.7%
Met or exceeded science standards: 60.9%
Four year graduation rate: 69%

Prev
Next
#40
Baker High
Baker School District
Enrollment: 501
Economically disadvantaged: 47%
Met or exceeded reading standards: 84.6%
Met or exceeded math standards: 73.6%
Met or exceeded writing standards: 65.9%
Met or exceeded science standards: 75.3%
Four year graduation rate: 77.8%
Prev
Next
#39
Oakland High
Oakland School District
Enrollment: 185
Economically disadvantaged: 50%
Met or exceeded reading standards: 91.5
Met or exceeded math standards: 83%
Met or exceeded writing standards: 68.1%
Met or exceeded science standards: 83%
Four year graduation rate: 86.1%
Prev
Next
#38
Newberg Senior High
Newberg School District
Enrollment: 1508
Economically disadvantaged: 42%
Met or exceeded reading standards: 87.9%
Met or exceeded math standards: 77.6%
Met or exceeded writing standards: 71.8%
Met or exceeded science standards: 68.3%
Four year graduation rate: 78.2%

Prev
Next
#37
West Salem High
Salem-Keizer School District
Enrollment: 1646
Economically disadvantaged: 35%
Met or exceeded reading standards: 92.7%
Met or exceeded math standards: 83.5%
Met or exceeded writing standards: 74.6%
Met or exceeded science standards: 74.2%
Four year graduation rate: 86.3%
Prev
Next
#36
Canby High
Canby School District
Enrollment: 1481
Economically disadvantaged: 32%
Met or exceeded reading standards: 87.3%
Met or exceeded math standards: 84%
Met or exceeded writing standards: 71.5%
Met or exceeded science standards: 61.6%
Four year graduation rate: 82.5%

Prev
Next
#35
Burns High
Harney County School District
Enrollment: 208
Economically disadvantaged: 33%
Met or exceeded reading standards: 76.2%
Met or exceeded math standards: 69%
Met or exceeded writing standards: 40.5%
Met or exceeded science standards: 83.3%
Four year graduation rate: 96.2%
Prev
Next
#34
Sheldon High
Eugene School District
Enrollment: 1399
Economically disadvantaged: 29%
Met or exceeded reading standards: 91.4%
Met or exceeded math standards: 77.7%
Met or exceeded writing standards: 69.1%
Met or exceeded science standards: 76.6%
Four year graduation rate: 72.4%
Prev
Next
#33
Oregon City Senior High
Oregon City School District
Enrollment: 2117
Economically disadvantaged: 34%
Met or exceeded reading standards: 97.5%
Met or exceeded math standards: 90.8%
Met or exceeded writing standards: 63%
Met or exceeded science standards: 76.7%
Four year graduation rate: 83%
Prev
Next
#32
Beaverton High
Beaverton School District
Enrollment: 1588
Economically disadvantaged: 43%
Met or exceeded reading standards: 90%
Met or exceeded math standards: 76.7%
Met or exceeded writing standards: 70.7%
Met or exceeded science standards: 65.4%
Four year graduation rate: 74.2%
Prev
Next
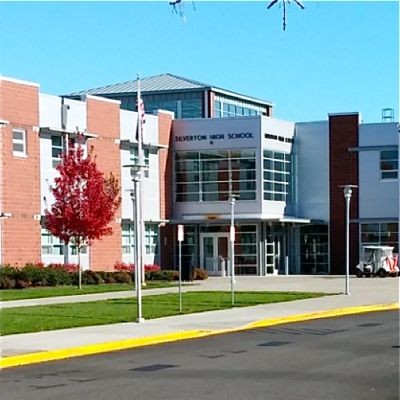
#31
Silverton High
Silver Falls School District
Enrollment: 1179
Economically disadvantaged: 41%
Met or exceeded reading standards: 86.1%
Met or exceeded math standards: 74.1%
Met or exceeded writing standards: 71.9%
Met or exceeded science standards: 72.1 %
Four year graduation rate: 77.7%
Prev
Next
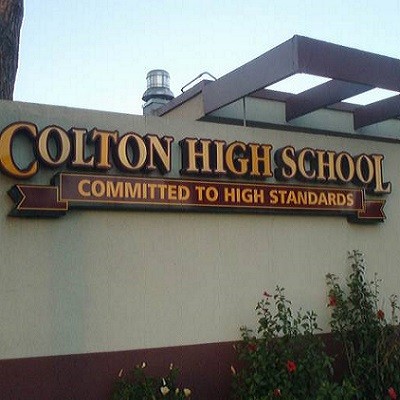
#30
Colton High
Colton School District
Enrollment: 215
Economically disadvantaged: 28%
Met or exceeded reading standards: 90%
Met or exceeded math standards: 76%
Met or exceeded writing standards: 68%
Met or exceeded science standards: 85.1%
Four year graduation rate: 95.2%
Prev
Next
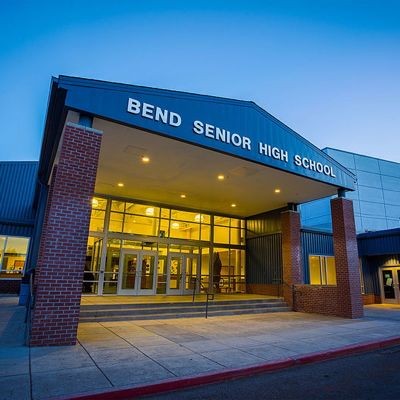
#29
Bend Senior High
Bend-LaPine School District
Enrollment: 1527
Economically disadvantaged: 40%
Met or exceeded reading standards: 92.7%
Met or exceeded math standards: 88.4%
Met or exceeded writing standards: 65.9%
Met or exceeded science standards: 75.6%
Four year graduation rate: 78.7%

Prev
Next
#28
Tualatin High
Tigard-Tualatin School District
Enrollment: 1714
Economically disadvantaged: 27%
Met or exceeded reading standards: 92.2%
Met or exceeded math standards: 76.7%
Met or exceeded writing standards: 62.9%
Met or exceeded science standards: 71.4%
Four year graduation rate: 84.4%

Prev
Next
#27
Mountain View Senior High
Bend-LaPine School District
Enrollment: 1283
Economically disadvantaged: 42%
Met or exceeded reading standards: 93.7%
Met or exceeded math standards: 82%
Met or exceeded writing standards: 75.2%
Met or exceeded science standards: 76.1%
Four year graduation rate: 78.3%
Photo Credit: Vince Kusters via Compfight cc

Prev
Next
#26
Tigard High
Tigard-Tualatin School District
Enrollment: 1835
Economically disadvantaged: 32%
Met or exceeded reading standards: 92.7%
Met or exceeded math standards: 83.5%
Met or exceeded writing standards: 64.5%
Met or exceeded science standards: 67.7%
Four year graduation rate: 80.8%
Prev
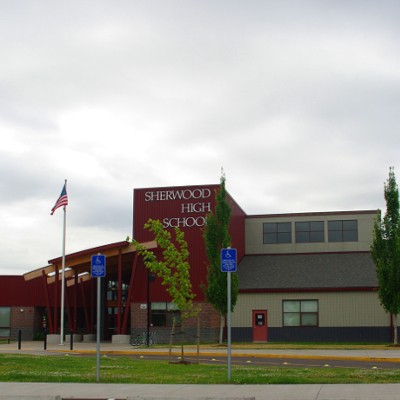
Next
#25
Sherwood High
Sherwood School District
Enrollment: 1469
Economically disadvantaged: 15%
Met or exceeded reading standards: 97.5%
Met or exceeded math standards: 85.8%
Met or exceeded writing standards: 62.2%
Met or exceeded science standards: 84.8%
Four year graduation rate: 91.3%
Prev
Next
#24
Corvallis High
Corvallis School District
Enrollment: 1184
Economically disadvantaged: 32%
Met or exceeded reading standards: 87.5%
Met or exceeded math standards: 79.8%
Met or exceeded writing standards: 69.2%
Met or exceeded science standards: 76.4%
Four year graduation rate: 70.7%

Prev
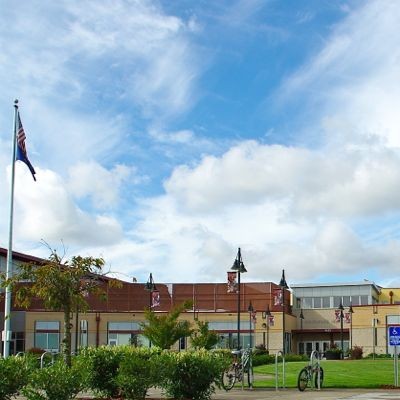
Next
#23
Sprague High
Salem-Keizer School District
Enrollment: 1608
Economically disadvantaged: 32%
Met or exceeded reading standards: 97.5%
Met or exceeded math standards: 86.2%
Met or exceeded writing standards: 72.5%
Met or exceeded science standards: 79.6%
Four year graduation rate: 82.2%
Photo Credit: Jirka Matousek via Compfight cc
Prev
Next
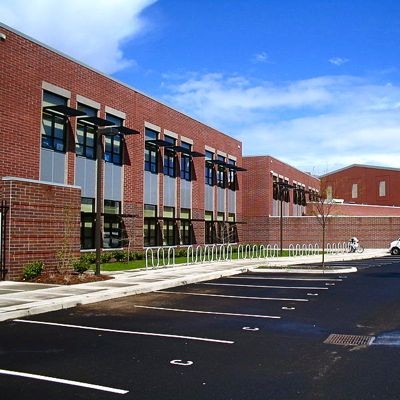
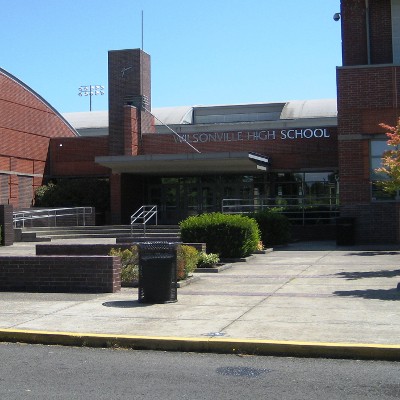
#22
Wilsonville High
West Linn-Wilsonville School District
Enrollment: 1093
Economically disadvantaged: 24%
Met or exceeded reading standards: 92.5%
Met or exceeded math standards: 74.1%
Met or exceeded writing standards: 74.2%
Met or exceeded science standards: 71.3%
Four year graduation rate: 85%

Prev
Next
#21
West Albany High
Greater Albany Public School District
Enrollment: 1317
Economically disadvantaged: 28%
Met or exceeded reading standards: 92.3%
Met or exceeded math standards: 87.5%
Met or exceeded writing standards: 75%
Met or exceeded science standards: 84.9%
Four year graduation rate: 93.6%
Photo Credit: jonas maaloe via Compfight cc

Prev
Next
#20
Clackamas High
North Clackamas School District
Enrollment: 2230
Economically disadvantaged: 29%
Met or exceeded reading standards: 91.7%
Met or exceeded math standards: 85.7%
Met or exceeded writing standards: 80.5%
Met or exceeded science standards: 74.2%
Four year graduation rate: 85.5%
Prev
Next
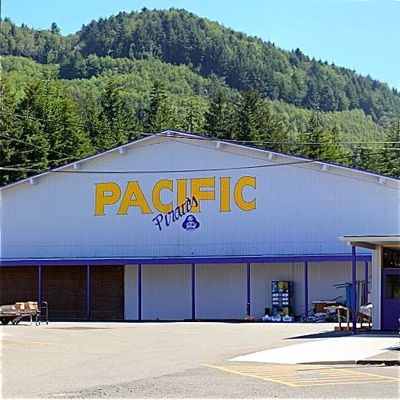
#19
Pacific High
Port Orford-Langlois School District
Enrollment: 90
Economically disadvantaged: 53%
Met or exceeded reading standards: 90.9%
Met or exceeded math standards: 59.1%
Met or exceeded writing standards: 77.3%
Met or exceeded science standards: 68.2%
Four year graduation rate: 78.3%
Photo Credit: Tedder - Own work. Licensed under CC BY 3.0 via Wikimedia Commons.
Prev
Next
#18
Southridge High
Beaverton School District
Enrollment: 1722
Economically disadvantaged: 27%
Met or exceeded reading standards: 91.5%
Met or exceeded math standards: 80.4%
Met or exceeded writing standards: 66.3%
Met or exceeded science standards: 68.9%
Four year graduation rate: 88.5%
Prev
Next
#17
Sisters High
Sisters School District
Enrollment: 480
Economically disadvantaged: 28%
Met or exceeded reading standards: 93.5%
Met or exceeded math standards: 74.1%
Met or exceeded writing standards: 77.8%
Met or exceeded science standards: 83.3%
Four year graduation rate: 88.4%

Prev
Next
#16
Glide High
Glide School District
Enrollment: 215
Economically disadvantaged: 45%
Met or exceeded reading standards: 97.5%
Met or exceeded math standards: 70.8%
Met or exceeded writing standards: 68.8%
Met or exceeded science standards: 93.8%
Four year graduation rate: 86.7%
Photo Credit: racka_abe via Compfight cc

Prev
Next
#15
Summit High
Bend-LaPine School District
Enrollment: 1344
Economically disadvantaged: 22%
Met or exceeded reading standards: 93.3%
Met or exceeded math standards: 74.6%
Met or exceeded writing standards: 73.6%
Met or exceeded science standards: 73.6%
Four year graduation rate: 88.3%
Photo Credit: frankjuarez via Compfight cc
Prev
Next
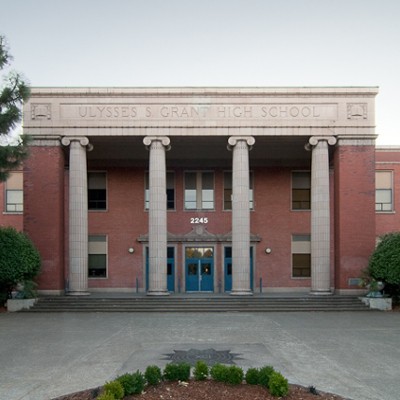
#14
Grant High
Portland School District
Enrollment: 1489
Economically disadvantaged: 24%
Met or exceeded reading standards: 92.6%
Met or exceeded math standards: 83.3%
Met or exceeded writing standards: 70.3%
Met or exceeded science standards: 66.4%
Four year graduation rate: 84.3%
Prev
Next
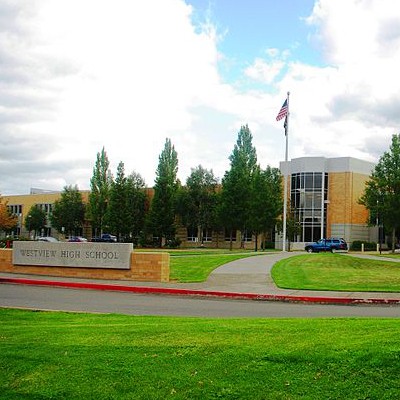
#13
Westview High
Beaverton School District
Enrollment: 2418
Economically disadvantaged: 33%
Met or exceeded reading standards: 92.2%
Met or exceeded math standards: 81.8%
Met or exceeded writing standards: 75.4%
Met or exceeded science standards: 70.3%
Four year graduation rate: 80.1%
Prev
Next
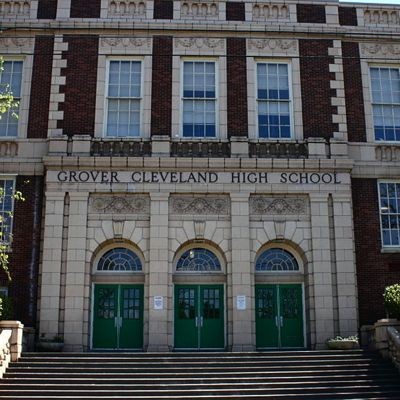
#12
Cleveland High
Portland School District
Enrollment: 1457
Economically disadvantaged: 29%
Met or exceeded reading standards: 92.6%
Met or exceeded math standards: 80.2%
Met or exceeded writing standards: 81.4%
Met or exceeded science standards: 59.7%
Four year graduation rate: 76.2%
Tedder - Own work. Licensed under CC BY 3.0 via Wikimedia Commons.

Prev
Next
#11
Sunset High
Beaverton School District
Enrollment: 1942
Economically disadvantaged: 29%
Met or exceeded reading standards: 94.7%
Met or exceeded math standards: 83.3%
Met or exceeded writing standards: 76.8%
Met or exceeded science standards: 79.7%
Four year graduation rate: 81.4%

Prev
Next
#10
Wilson High
Portland School District
Enrollment: 1185
Economically disadvantaged: 22%
Met or exceeded reading standards: 91.8%
Met or exceeded math standards: 80.4%
Met or exceeded writing standards: 82.8%
Met or exceeded science standards: 63.8%
Four year graduation rate: 84.4%
Photo Credit: KristinNador via Compfight cc

Prev
Next
#9
Ashland High
Ashland School District
Enrollment: 940
Economically disadvantaged: 28%
Met or exceeded reading standards: 97.5%
Met or exceeded math standards: 85.8%
Met or exceeded writing standards: 79.8%
Met or exceeded science standards: 77.2%
Four year graduation rate: 86.1%
Prev
Next
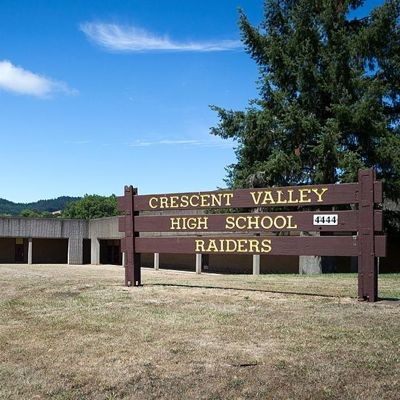
#8
Crescent Valley High
Corvallis School District
Enrollment: 965
Economically disadvantaged: 23%
Met or exceeded reading standards: 97.5%
Met or exceeded math standards: 85.3%
Met or exceeded writing standards: 78.1%
Met or exceeded science standards: 77.8%
Four year graduation rate: 70.1%
Photo Credit: Visitor7 - Own work. Licensed under CC BY-SA 3.0 via Wikimedia Commons.
Prev
Next
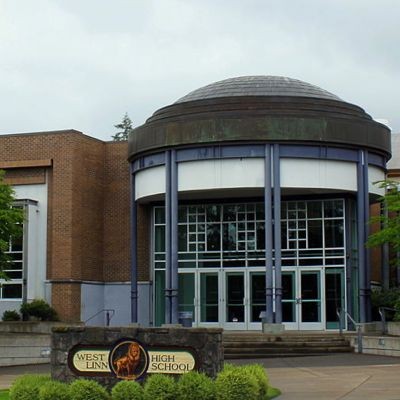
#7
West Linn High
West Linn-Wilsonville School District
Enrollment: 1514
Economically disadvantaged: 10%
Met or exceeded reading standards: 97.5%
Met or exceeded math standards: 87.9%
Met or exceeded writing standards: 85.8%
Met or exceeded science standards: 83.2%
Four year graduation rate: 93.2%
Photo Credit: Tedder - Own work. Licensed under CC BY 3.0 via Wikimedia Commons.

Prev
Next
#6
Riverdale High
Riverdale School District
Enrollment: 242
Economically disadvantaged: <6%*
Met or exceeded reading standards: 97.5%
Met or exceeded math standards: 89.8%
Met or exceeded writing standards: 74.6%
Met or exceeded science standards: 74.6%
Four year graduation rate: 94.2%
*numbers less than 6% are represented by an asterisk in the Oregon Department of Education data.

Prev
Next
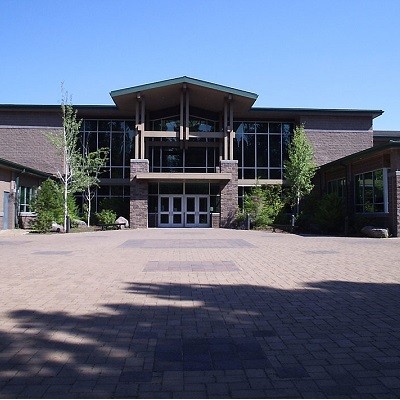
#5
School of Science & Technology
Beaverton School District
Enrollment: 167
Economically disadvantaged: 20%
Met or exceeded reading standards: 97.5%
Met or exceeded math standards: 97.5%
Met or exceeded writing standards: 86%
Met or exceeded science standards: 63.9%
Four year graduation rate: 81.1%
Photo Credit: Maya83 via Compfight cc
Prev
Next
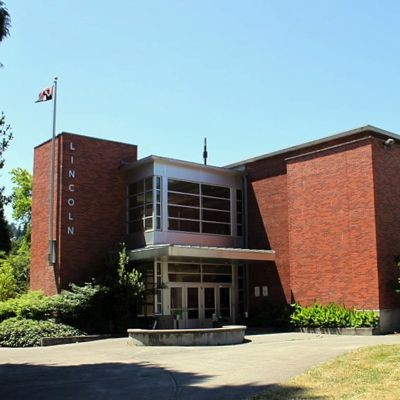
#4
Lincoln High
Portland School District
Enrollment: 1471
Economically disadvantaged: 12%
Met or exceeded reading standards: 92.5%
Met or exceeded math standards: 85.3%
Met or exceeded writing standards: 88.1%
Met or exceeded science standards: 79.9%
Four year graduation rate: 89.3%
Photo Credit: Tedder - Own work. Licensed under CC BY 3.0 via Wikimedia Commons.
Prev
Next
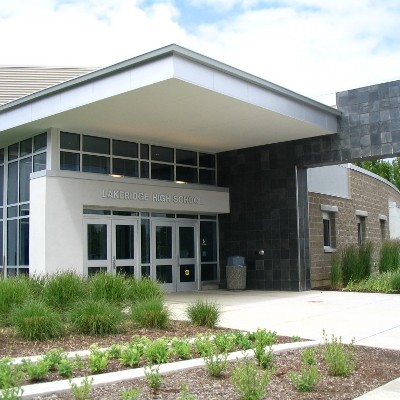
#3
Lakeridge High
Lake Oswego School District
Enrollment: 1078
Economically disadvantaged: 8%
Met or exceeded reading standards: 97.5%
Met or exceeded math standards: 93.9%
Met or exceeded writing standards: 91.8%
Met or exceeded science standards: 92.1%
Four year graduation rate: 89.8%

Prev
Next
#2
South Eugene High
Eugene School District
Enrollment: 1321
Economically disadvantaged: 24%
Met or exceeded reading standards: 97.5%
Met or exceeded math standards: 91.6%
Met or exceeded writing standards: 84.9%
Met or exceeded science standards: 89.2%
Four year graduation rate: 79.4%
Photo Credit: katalicia1 via Compfight cc
Prev
Next
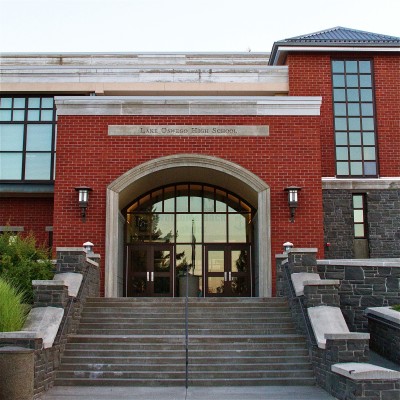
#1
Lake Oswego Senior High
Lake Oswego School District
Enrollment: 1224
Economically disadvantaged: 6%
Met or exceeded reading standards: 97.5%
Met or exceeded math standards: 92.4%
Met or exceeded writing standards: 89.1%
Met or exceeded science standards: 87.7%
Four year graduation rate: 89.5%
Photo Credit: KristinNador via Compfight cc
Enjoy this post? Share it with others.
Email to a friend
Permalink


_80_80_90_c1.JPG)


Follow us on Pinterest Google + Facebook Twitter See It Read It