Number of IEDs Found in Portland Declines Sharply in 2014


 Email to a friend
Permalink
Email to a friend
Permalink
Thursday, January 22, 2015
Cornelius Swart, GoLocal PDX Director of Content
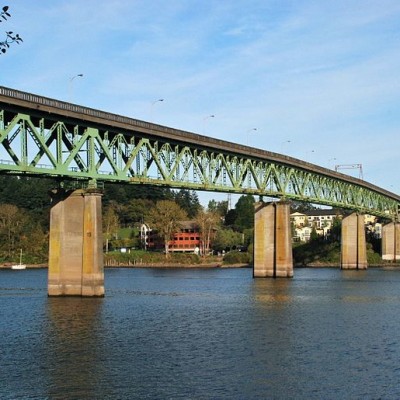
Photo credit: WikiMedia
The number of improvised explosive devices found in Portland dropped significantly in 2014, a trend mirrored around the state and one that leaves law enforcement officials scratching their heads.
Although a number of high-profile cases involving explosive devices made headlines in 2014, the overall number of devices found in Portland declined roughly 36 percent over the course of the year, according to an analysis of police data by GoLocalPDX.
“We’re down and don’t ask me why, we don’t know,” said Sgt. Michael Unsworth of the Portland Police Bureau’s Metropolitan Explosive Disposal Unit (MEDU).
Most recently, Portland Police arrested Neal Allen Panschow, 43, after he allegedly threw four pipe bombs at officers during an east Portland car chase last December.
In October, an explosive device detonated inside a car near Markham Elementary School in Southwest Portland. Later that month, Portland’s bomb squad removed a pipe loaded with a shotgun shell, connected to a tripwire, from a trail in Forest Park. No one was injured in any of the incidents.
Yet despite these alarming cases, the incidence of improvised explosive devices in the city dropped significantly.
IEDs found in Portland Each Year
Nationally, there were 5,909 explosive incidents in 2013 that caused 390 injuries and 31 fatalities, according to the most recent statistics from the Federal Bureau of Alcohol, Firearms, Tobacco and Explosives (ATF).
On any given year, Portland police recover or destroy about two dozen or more IEDs, mostly in the form of pipe bombs and bottle bombs, according to the data. Some are found at crime scenes or in public places like parks, school grounds or outhouses.
Since 2009, that number has held fairly steady, varying by only two or three IEDs each year. But in 2014, the number of IEDS recovered and destroyed dropped dramatically, and law enforcement officials around the region are not sure why.
Unsworth said his agency saw a decline in IEDs throughout the metro area.
“We are hearing the same thing in Salem and Eugene,” Unsworth said.
Portland’s MBDU goes on 350 to 400 service calls every year. Of them, only a few dozen wind up being improvised explosive devices that require destruction or removal by the unit’s bomb disposal robot.
Arrest for possession or manufacture of an explosive device is fairly rare, according to Unsworth.
Sgt Kevin DelGrande with the Oregon State Police’s Explosive Unit said that his detail saw the same decline this year. Predominantly, state police respond to rural explosive disposal cases.
“The majority of our cases are actually disposal of commercial explosives,” DelGrande said. “People find things that were once used for mining and agricultural purposes.”
About half of the IEDs built with what police determine to be criminal intent are found at crime scenes and the other half are found in public, DelGrande said.
Long Term Trends and Mega Bombs
Unsworth said thankfully no one has been injured by IEDs found in public in Portland this year. He characterized most of the devices as “mischief,” devised by young adults and teens.
“They tend to be [found] in big school yards, golf courses, any open field,” Unsworth said. “That’s where people go at night and say ‘Let’s blow things up.’”
Unsworth said that the long-term trend in IEDs has been going down for years.
“When I started 20 years ago, pipe bombs were everywhere,” he said. “But since 9/11, people understand that these things are serious and people do get hurt.”
That said, he sees an alarming trend in people using recipes they find on the Internet to build large explosive devices with household chemicals and other publicly available compounds.
These types of explosives, like the fertilizer bomb Timothy McVeigh used to destroy the Alfred P. Murrah Building in Oklahoma City, “but worse,” are rare but extremely deadly, Unsworth said. Increasingly, the know-how to build them is widely available on the web, Unsworth said.
“Those are the ones that scare us,” he said. “That’s a true concern.”
Related Slideshow: Portland’s 35 Most Dangerous Neighborhoods
* Rankings have been adjusted since their original posting to better reflect all neighborhood boundaries that make contact with the city's most dangerous intersections.
Prev
Next
#35
Buckman-East
Calls for police: 1,714
Fire incidents: 162
City's most dangerous intersections: none
*Police stats are violent crimes only. Both police and fire stats represent totals for five years
Prev
Next
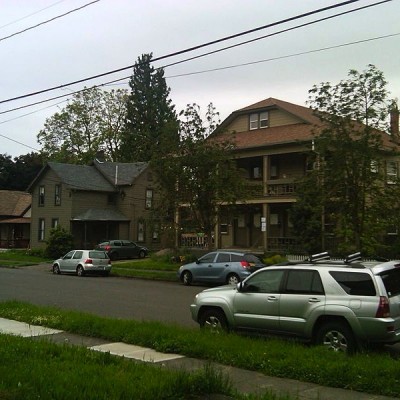
#34
Overlook
Calls for police: 1,792
Fire incidents: 139
City's most dangerous intersections: none
*Police stats are violent crimes only. Both police and fire stats represent totals for five years
Prev
Next
#33
King
Calls for police: 1,431
Fire incidents: 115
City's most dangerous intersections:
- Northeast Killingsworth St./ Northeast Martin Luther King Jr. Blvd. Total crashes: 57
*Police stats are violent crimes only. Both police and fire stats represent totals for five years
Prev
Next
#32
Buckman-West
Calls for police: 2,547
Fire incidents: 213
City's most dangerous intersections: none
*Police stats are violent crimes only. Both police and fire stats represent totals for five years
Prev
Next
#31
Kerns
Calls for police: 1,853
Fire incidents: 165
City's most dangerous intersections: none
*Police stats are violent crimes only. Both police and fire stats represent totals for five years
Prev
Next
#30
Hosford-Abernethy
Calls for police: 2,248
Fire incidents: 126
City's most dangerous intersections:
- Southeast 7th Ave./ Southeast Powell Blvd. Total crashes: 114
*Police stats are violent crimes only. Both police and fire stats represent totals for five years
Prev
Next
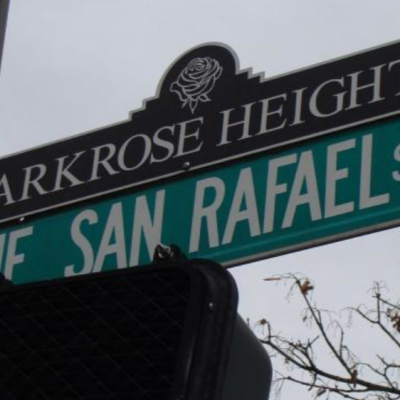
#29
Parkrose Heights
Calls for police: 1,064
Fire incidents: 86
City's most dangerous intersections:
- Northeast 122nd Ave./ Northeast Halsey St. Total crashes: 99
- Northeast 102nd Ave./ Northeast Halsey St. Total crashes: 56
*Police stats are violent crimes only. Both police and fire stats represent totals for five years
Prev
Next
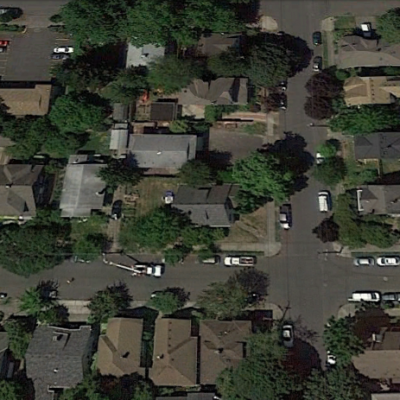
#28
Creston-Kenilworth
Calls for police: 1,750
Fire incidents: 133
City's most dangerous intersections:
- Southeast Cesar E Chavez Blvd. / Southeast Powell Blvd.Total crashes: 104
- Southeast 50th Ave. / Southeast Foster Rd. / Southeast Powell Blvd. Total crashes: 53
*Police stats are violent crimes only. Both police and fire stats represent totals for five years
Prev
Next
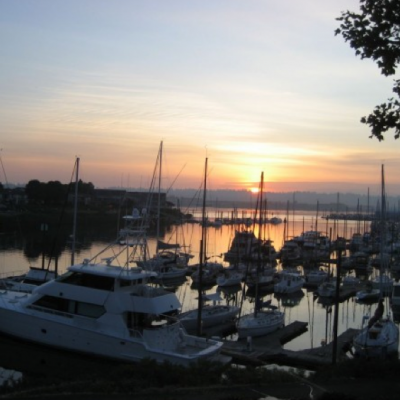
#27
Hayden Island
Calls for police: 2,043
Fire incidents: 136
City's most dangerous intersections: none
*Police stats are violent crimes only. Both police and fire stats represent totals for five years
Prev
Next
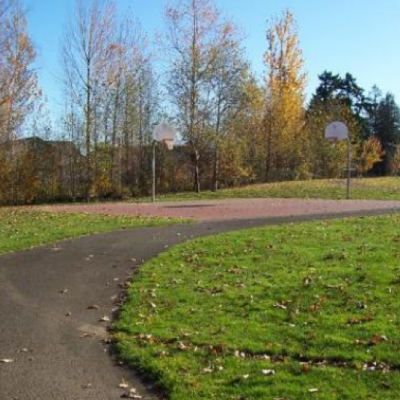
#26
Wilkes
Calls for police: 1,269
Fire incidents: 102
City's most dangerous intersections: none
*Police stats are violent crimes only. Both police and fire stats represent totals for five years
Prev
Next
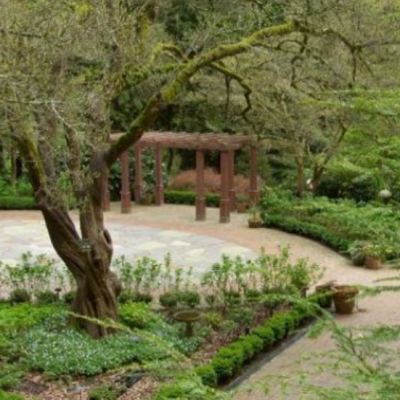
#25
Pleasant Valley
Calls for police: 1,102
Fire incidents: 89
City's most dangerous intersections:
- Southeast 174th Ave./ Southeast Powell Blvd. Total crashes: 111
- Southeast 122nd Ave. / Southeast Foster Rd. Total crashes: 53
- Southeast 148th Ave. / Southeast Stark St. Total crashes: 96
*Police stats are violent crimes only. Both police and fire stats represent totals for five years
Prev
Next
#24
Lloyd
Calls for police: 4851
Fire incidents: 187
City's most dangerous intersections:
- North Broadway / North Vancouver Ave. / Northeast I5 FWY-Broadway Ramp. Total crashes: 68
- Northeast Broadway/ Northeast Grand Ave. Total crashes: 68
- North Broadway / North Williams Ave. Total crashes: 62
*Police stats are violent crimes only. Both police and fire stats represent totals for five years
Prev
Next
#23
Madison South
Calls for police: 1,380
Fire incidents: 112
City's most dangerous intersections:
- Northeast 82nd Ave. / Northeast Sandy Blvd. Total crashes: 57
(photo courtesy of Neighborhood Notes)
*Police stats are violent crimes only. Both police and fire stats represent totals for five years
Prev
Next
#22
Richmond
Calls for police: 2,272
Fire incidents: 117
City's most dangerous intersections:
- Southeast Cesar E. Chavez Blvd./ Southeast Powell Blvd. Total crashes: 104
- Southeast 50th Ave./ Southeast Foster Rd./ Southeast Powell Blvd. Total crashes: 53
*Police stats are violent crimes only. Both police and fire stats represent totals for five years
Prev
Next
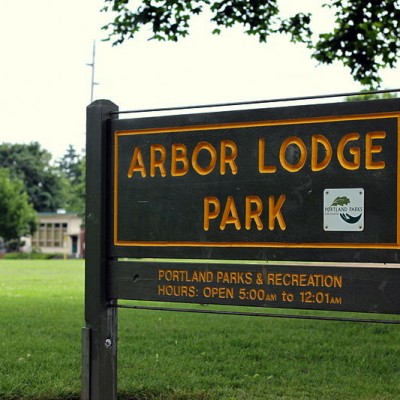
#21
Arbor Lodge
Calls for police: 1,843
Fire incidents: 81
City's most dangerous intersections:
- North Interstate Ave./ North Lombard St. Total crashes: 64
*Police stats are violent crimes only. Both police and fire stats represent totals for five years
Prev
Next
#20
Parkrose
Calls for police: 2,590
Fire incidents: 198
City's most dangerous intersections: none
*Police stats are violent crimes only. Both police and fire stats represent totals for five years
Prev
Next
#19
Northwest
Calls for police: 4,850
Fire incidents: 288
City's most dangerous intersections: none
*Police stats are violent crimes only. Both police and fire stats represent totals for five years
Prev
Next
#18
Mt. Scott-Arleta
Calls for police: 1,760
Fire incidents: 98
City's most dangerous intersections:
- Southeast 82nd Ave. / Southeast Foster Rd. Total crashes: 78
*Police stats are violent crimes only. Both police and fire stats represent totals for five years
Prev
Next
#17
Brentwood-Darlington
Calls for police: 2,038
Fire incidents: 159
City's most dangerous intersections: none
*Police stats are violent crimes only. Both police and fire stats represent totals for five years
Prev
Next
#16
Sellwood-Moreland
Calls for police: 2,243
Fire incidents: 132
City's most dangerous intersections:
- Southeast 13th Ave./ Southeast Tacoma St. Total crashes: 53
- Southeast Holgate Blvd./ Southeast McLoughlin Blvd. Total crashes: 35
*Police stats are violent crimes only. Both police and fire stats represent totals for five years
Prev
Next
#15
Eliot
Calls for police: 2,106
Fire incidents: 114
City's most dangerous intersections:
- North Broadway/ North Vancouver Ave./ Northeast I-5 FWY. Total crashes: 68
- Northeast Broadway/ Northeast Grand Ave. Total crashes: 68
- North Broadway/ North Williams Ave. Total crashes: 62
*Police stats are violent crimes only. Both police and fire stats represent totals for five years
Prev
Next
#14
St. Johns
Calls for police: 3,397
Fire incidents: 228
City's most dangerous intersections: none
*Police stats are violent crimes only. Both police and fire stats represent totals for five years
Prev
Next
#13
Portsmouth
Calls for police: 1,820
Fire incidents: 161
City's most dangerous intersections: none
*Police stats are violent crimes only. Both police and fire stats represent totals for five years
Prev
Next
#12
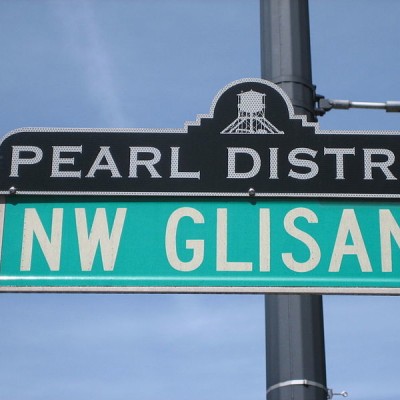
Pearl
Calls for police: 3,833
Fire incidents: 205
City's most dangerous intersections:
- Northwest Broadway/ Northwest Couch St. Total crashes: 82
*Police stats are violent crimes only. Both police and fire stats represent totals for five years
Prev
Next
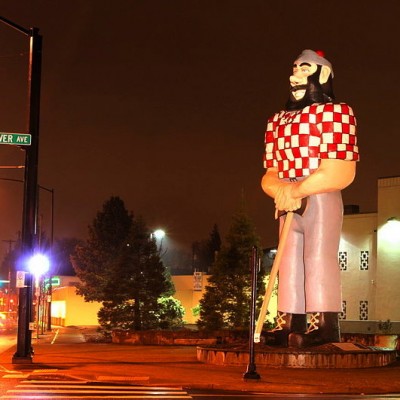
#11
Kenton
Calls for police: 1,885
Fire incidents: 251
City's most dangerous intersections:
- North Interstate Ave./ North Lombard St. Total crashes: 64
*Police stats are violent crimes only. Both police and fire stats represent totals for five years
Prev
Next
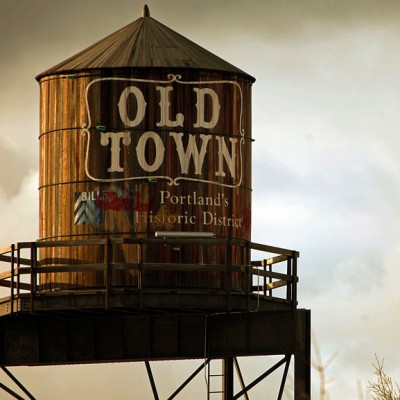
#10
China/Old Town
Calls for police: 3,258
Fire incidents: 60
City's most dangerous intersections:
- Northwest Broadway / Northwest Couch St. Total crashes: 82
*Police stats are violent crimes only. Both police and fire stats represent totals for five years
Prev
Next
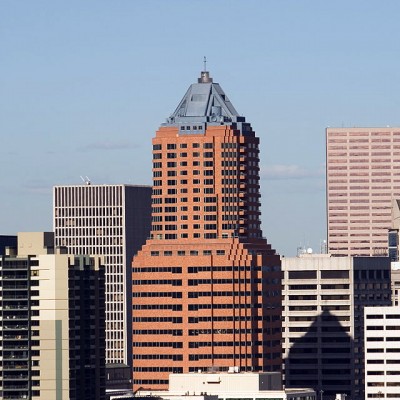
#9
Downtown
Calls for police: 9,238
Fire incidents: 570
City's most dangerous intersections: none
*Police stats are violent crimes only. Both police and fire stats represent totals for five years
Prev
Next
#8
Cully
Calls for police: 2,787
Fire incidents: 177
City's most dangerous intersections:
- Northeast 82nd Ave./ Northeast Killingsworth St. Total crashes: 49
- Northeast Columbia Blvd. / Northeast I-205 Southbound / Columbia Blvd. Ramps. Total crashes: 84
- Northeast 82nd Ave. / Northeast Killingsworth St.Total crashes: 49
*Police stats are violent crimes only. Both police and fire stats represent totals for five years
_400_400_90.jpg)
Prev
Next
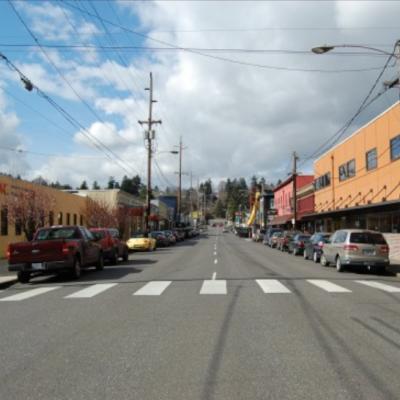
#7
Foster-Powell
Calls for police: 2,314
Fire incidents: 125
City's most dangerous intersections:
- Southeast 82nd Ave./ Holgate Blvd. Total crashes: 68
- Southeast 82nd Ave. / Southeast Powell Blvd. Total crashes: 171
- Southeast 82nd Ave. / Southeast Foster Rd. Total crashes: 78
*Police stats are violent crimes only. Both police and fire stats represent totals for five years
Prev
Next
#6
Mill Park
Calls for police: 2,108
Fire incidents: 171
City's most dangerous intersections:
- Southeast 122nd Ave./ Southeast Stark St. Total crashes: 156
- Southeast 112th Ave. / Southeast Division St. Total crashes: 71
- Southeast 122nd Ave. / Southeast Division St. Total crashes: 170
*Police stats are violent crimes only. Both police and fire stats represent totals for five years
Prev
Next
#5
Montavilla
Calls for police: 3,695
Fire incidents: 229
City's most dangerous intersections:
- Southeast 82nd Ave./ Southeast Division St. Total crashes: 102
- Northeast 82nd Ave./ Northeast Glisan Total crashes: 98
- East Burnside St./ Northeast 82nd Ave./ Southeast 82nd Ave. Total crashes: 62
- Southeast 92nd Ave./ Southeast Division St. Total crashes: 59
- Northeast Glisan St. / Northeast Glisan St. to I-205 Southbound Ramp. Total crashes: 51
- Southeast Division St. / Southeast Division St.-I205 FWY Ramp / Southeast I205 FW0Y. Total crashes: 55
*Police stats are violent crimes only. Both police and fire stats represent totals for five years
Prev
Next
#4
Centennial
Calls for police: 5,568
Fire incidents: 254
City's most dangerous intersections:
- Southeast 174th Ave./ Southeast Powell Blvd. Total crashes: 111
- Southeast 148th Ave./ Southeast Division St. Total crashes: 69
- Southeast 162nd Ave./ Southeast Division St. Total crashes: 92
- Southeast 174th Ave./ Southeast Division St. Total crashes: 56
- Southeast 162nd Ave. / Southeast Stark St. Total crashes: 55
*Police stats are violent crimes only. Both police and fire stats represent totals for five years
Prev
Next
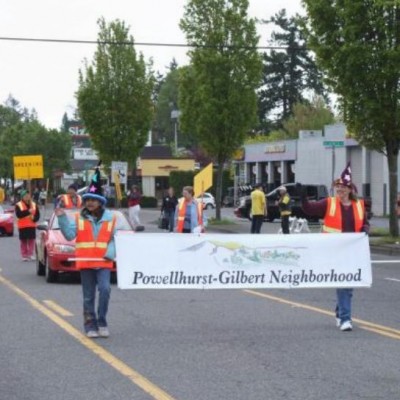
#3
Powelhurst-Gilbert
Calls for police: 6,025
Fire incidents: 394
City's most dangerous intersections:
- Southeast 122nd Ave./ Southeast Division St. Total crashes: 170
- Southeast 122nd Ave./ Southeast Powell Blvd. Total crashes: 125
- Southeast 136 Ave./ Southeast Powell Blvd. Total crashes: 77
- Southeast 112th Ave./ Southeast Powell Blvd. Total crashes: 56
- Southeast 96th Dr./ Southeast Division St./ Southeast I-205 Northbound to Division. Total crashes: 79
- Southeast 122nd Ave./ Southeast Foster Rd. Total crashes: 53
- Southeast 82nd Ave. / Southeast Division St. Total crashes: 102
- Southeast 92nd Ave. / Southeast Powell Blvd. Total crashes: 99
- Southeast 92nd Ave. / Southeast Division St. Total crashes: 59
- Southeast Division St. / Southeast Division St-I205 Fwy Ramp / Southeast I205. Total crashes: 55
- Southeast 82nd Ave. / Southeast Powell Blvd. Total crashes: 171
- Southeast 112th Ave. / Southeast Division St. Total crashes: 71
*Police stats are violent crimes only. Both police and fire stats represent totals for five years
Prev
Next
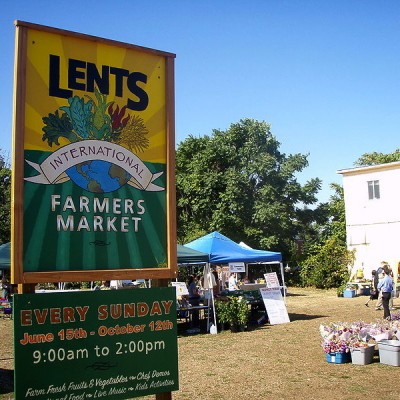
#2
Lents
Calls for police: 6,973
Fire incidents: 419
City's most dangerous intersections:
- Southeast 92nd Ave./ Southeast Powell Blvd. Total crashes: 99
- Southeast 92nd Ave./ Southeast Holgate Blvd. Total crashes: 67
- Southeast 82nd Ave./ Southeast Foster Rd. Total crashes: 78
- Southeast 92nd Ave./ Southeast Foster Rd. Total crashes: 64
- Southeast Foster Rd./ Southeast 96th Ave./ Southeast Foster to I-205. Total crashes: 59
- Southeast 82nd Ave./ Southeast Flavel St. Total crashes: 49
- Southeast Foster Rd./ Southeast 94th Ave./ I-205 FWY. Total crashes: 49
- Southeast 82nd Ave. / Southeast Holgate Blvd. Total crashes: 68
- Southeast 82nd Ave. / Southeast Powell Blvd. Total crashes: 171
*Police stats are violent crimes only. Both police and fire stats represent totals for five years
**This slide previously included the intersection "Southesat Holgate Blvd./Southeast Mcloughlin Blv." which is not in the Lents neighborhood. It has since been removed**
Prev
Next
#1
Hazelwood
Calls for police: 10,136
Fire incidents: 483
City's most dangerous intersections:
- Northeast 122nd Ave./ Northeast Glisan St. Total crashes: 144
- Northeast 102nd Ave./ Northeast Glisan St. Total crashes: 110
- Northeast Glisan St./ Northeast Glisan St. to I-205 Northbound ramp. Total crashes: 87
- Southeast 96th Ave./ Southeast 99th Ave./ Southeast Washington St. Total crashes: 66
- Southeast 112th Ave./ Southeast Division St. Total crashes: 71
- Northeast Glisan St./ Northeast Glisan St. to I-205 Southbound ramp. Total crashes: 51
- Southeast 102nd Ave./ Southeast Stark St. Total crashes: 54
- Southeast Division St./Southeast Division St. to I-205 ramp. Total crashes: 55
- Northeast 99th Ave./ Northeast Glisan St. Total crashes: 53
- 122nd Ave. / Southeast Stark St. Total crashes: 156
- Southeast 136th Ave. / Southeast Powell Blvd. Total crashes: 77
- Southeast 148th Ave. / Southeast Stark St. Total crashes: 96
- Southeast 96th Dr. / Southeast Division St. / Southeast I-205 Northbound ramp to Division St. ramp. Total crashes: 79
- Northeast 102nd Ave. / Northeast Halsey St. Total crashes: 56
- Northeast 122nd Ave. / Northeast Halsey St. Total crashes: 99
*Police stats are violent crimes only. Both police and fire stats represent totals for five years
Related Articles
Enjoy this post? Share it with others.
Email to a friend
Permalink


_80_80_90_c1.jpg)


Follow us on Pinterest Google + Facebook Twitter See It Read It