Oregon Expands Public Access to Preschool: Will it Help?


Thursday, August 13, 2015
While some advocates say this will help improve kindergarten readiness and feed into Oregon’s goals of raising graduation rates and improving college attainment, others are concerned that a more rigorous approach to education will actually achieve the opposite.
Nonetheless, the new bill expands free access past the federal Head Start program, which sets a limit at 100 percent of the poverty level. That amounts to 22 percent of children in Oregon, though the program only reaches about half of those.
“There’s usually a wait list (for Head Start),” said Dana Hepper, director of policy and program at the Children’s Institute, one of the lead advocates of the bill. “Many more families don’t sign up for the wait list because they don’t think they have a shot at getting in.”
Besides Head Start, some families pay for private preschool for their children, while others enroll in other kinds of public programs, such as those available through school districts.
A report by the Education Week Research Center indicates that about 40.5 percent of 3 and 4 year olds in Oregon were enrolled in preschool in 2013. That compares to about 47.8 percent nationally. Of those attending pre-K, about 44 percent attended private and 56 percent attended public.
The Ed Week analysis indicated that children from more affluent households had the highest rates of preschool participation across the nation. Other factors included parental education levels, race and ethnicity, and the state where a child lives.
Data on the average cost of private preschool in Oregon is difficult to find, though a ChildCare Aware report indicates the cost for “center-based care,” which could include Head Start, preschool or a childcare center. Oregon was the third least affordable state for a four-year-old in center-based care. Parents paid an annual average of $8,615 in 2013 (or around $718 per month)—which is out of reach for many parents.
The state’s $27 million still won’t pay for preschool for all children at the 200 percent of poverty level threshold, but “it’s a step in the right direction,” said Hepper.
The money will likely be targeted for preschools meeting certain quality requirements, whether public or private, though an actual delivery system has not yet been planned.
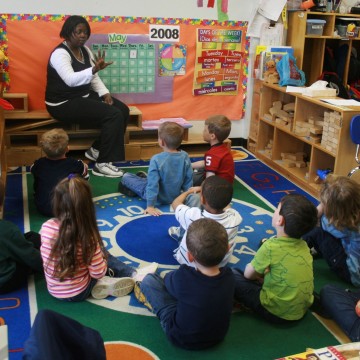
The Children’s Institute used the Oregon Kindergarten Assessment results to argue in support of House Bill 3380. “Our work to expand pre-k could call on data from the kindergarten assessment and say, ‘Look how many are unprepared for kindergarten,’” said spokesman Katia Riddle.
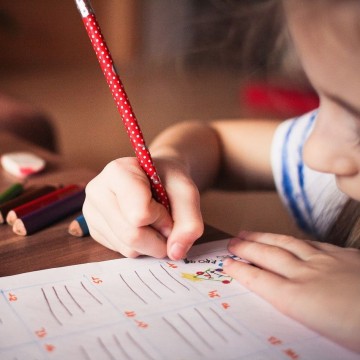
The Oregon Kindergarten Assessment, which started in 2013, is often given on the first day of school or during an orientation. It includes early literacy, early numeracy and a social/emotional checklist that the teacher fills out as they observe. Of those that took the test in last year, 25 percent did not have self-regulation skills, and 37 percent couldn’t identify a single letter sound.
“If children broadly had access to high quality learning, more children would come to kindergarten with self regulation to thrive with beginning understanding of letter names and letters sounds and basic numeracy skills,” said Hepper.
While some parents and education advocates are not happy about the kindergarten assessment, Hepper said that the test isn’t really anything new. “Teachers have always been giving this,” she said, “A lot of teachers have wanted to know where they’re kids were… so they can tailor their level of instruction.”
Additionally many have their own informal ways of assessing students throughout the year. The only new part is that the state is now collecting the data.
“The data is reported to the state and the idea is that over time, this can help us better serve populations of underserved children—to make sure all kids are having high quality access to early learning activities,” said Hepper, “and it’s a way to track our progress overtime, to inform policymakers about where they are.”
But that is exactly what Oregon Save Our Schools argues is not helpful about the kindergarten assessment. Tying policy to test scores puts too much pressure on kids and makes education more “academic” and less enjoyable—exactly what doesn’t make sense for low income students, said Dana Brenner-Kelley, an Oregon SOS member.
A former Washington state Head Start Association director, she said what kids need at an early age is play-based learning. “They’re trying to push the Common Core and academics further down into early education,” she said. She doesn’t see this approach producing the results intended.
Yet, for education advocates on the other side, more integration of preschool into the K-12 system should help improve outcomes.
Early Works
One noteworthy example of better alignment with public school districts is the Early Works program, which is a partnership between the Children’s Institute and David Douglas School District. Begun in 2010 at Earl Boyles Elementary School in the Powellhurst-Gilbert neighborhood, the program is open to any children living within the school boundaries. Today it serves all 4 year olds and most of the 3 year olds in the neighborhood.
So far, just having preschool teachers and kindergarten teachers on the same staff has allowed some sharing of best practices.
“Our goal is to learn and to understand from a public policy standpoint what policies are supporting this kind of integration and what kind of policies are getting in the way,” said Hepper.
As for kindergarten preparation, Hepper said that Earl Boyles teaches social and emotional development approaches to learning, early reading and numeracy—skills that are tested on the kindergarten assessment. “We certainly see kids doing better on the kindergarten assessment,” she said, “which I expect you would see with any child who goes through a high quality preschool.”
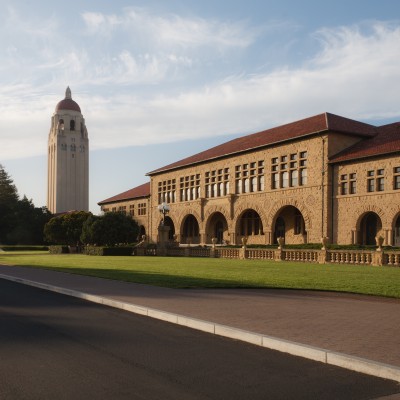
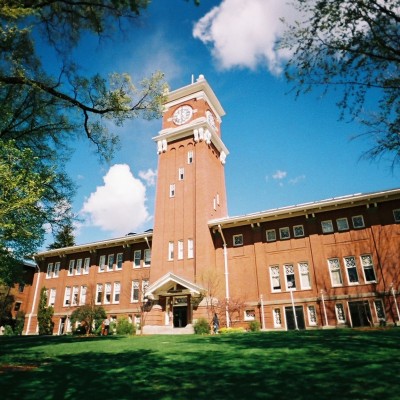
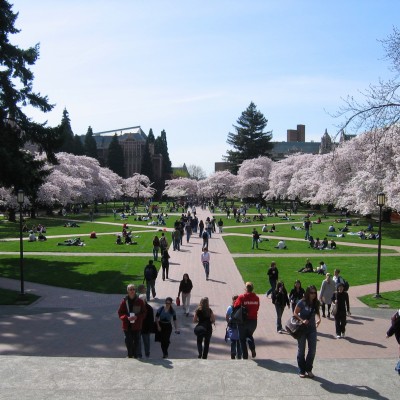
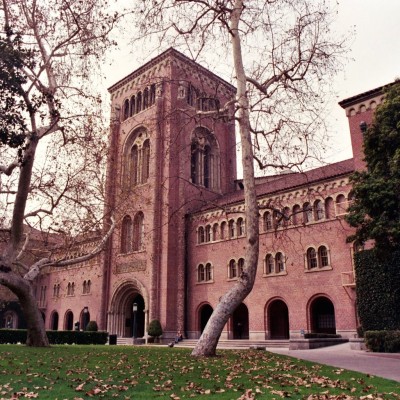
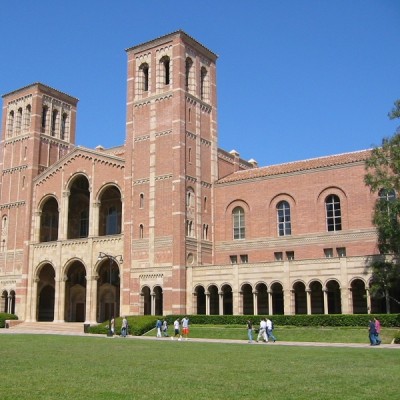
Related Slideshow: Ranking of Student Diversity in Pac-12 Schools
Rates of diversity among Pac-12 schools run the gamut between holding a hefty majority to scraping by with a slim minority. UCLA had a whopping 69.8%, compared to the University of Oregon's 20.9%. In fact, Univerity of Oregon ranked as the least diverse among the 12 schools in the conference. Using demographic data for the 2013-2014 school year provided by each university, GoLocalPDX sorted the schools by their rates of diversity within their student bodies. *University of Utah latest available data was from 2012-2013.
_-_5_400_400_90.jpg)


_-_5_80_80_90_c1.jpg)


Related Articles
- Two 1sts for Kindergarteners: Standardized Test & the 1st Day of School
- Shiny, Happy Kindergarteners: Five Tips for Your Child’s First Day of School
- Letter To My Child’s Kindergarten Teacher
- K-12 Schools Budget Passes Oregon House on Party-Line Vote
- Knowledge Universe and Partners Donate School Supplies to Students at Beach Elementary


Follow us on Pinterest Google + Facebook Twitter See It Read It