slides: Portland’s 20 Hottest Neighborhoods for Real Estate


 Email to a friend
Permalink
Email to a friend
Permalink
Tuesday, February 03, 2015
Joanna Evoniuk, GoLocalPDX Contributor
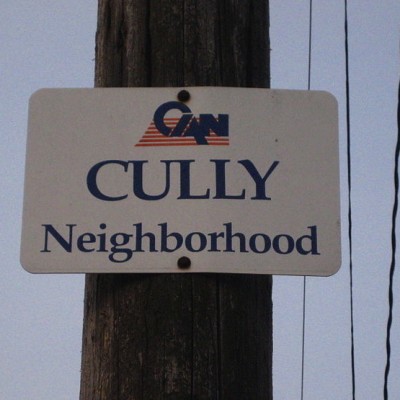
Over half of Portland’s hottest real estate neighborhoods are near or east of 82nd Street, according to data pulled from the real estate brokerage
Redfin.
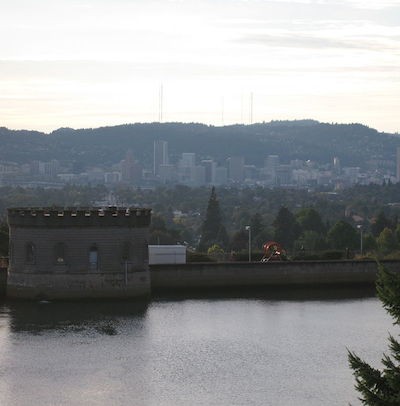
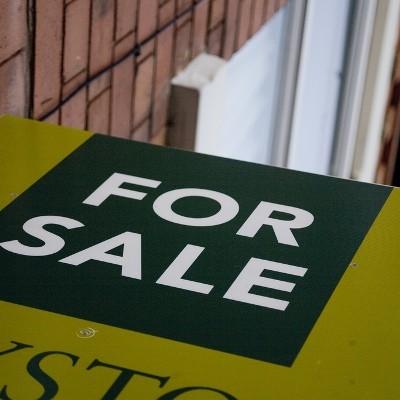
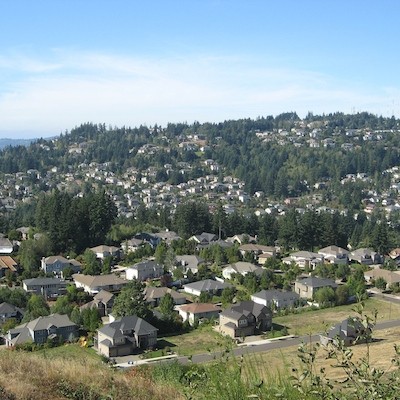
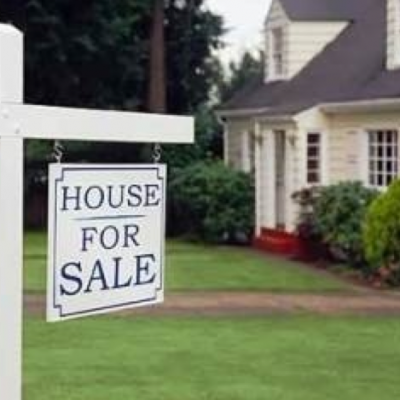
Portland’s real estate market for sellers is probably the hottest it has ever been, especially for the east side of the city. Of neighborhoods that sold the most home over the last 90 days, the top five are located in East Portland. Over 80 homes were sold in the Brentwood-Darlington area, the highest of any neighborhood.
Historically low property values have kept home prices in East Portland comparatively cheap compared to other parts of the city. Meanwhile, a shortage of available single family homes makes property on the eastside in high demand.
Low inventory and high prices are driving the real estate market in all of Portland, according to Jan Caplener one of the owners of Portland’s Reality Trust.
“Right now, Portland especially, is the hottest you can have. There are way more sellers than buyers,” Caplener said. “Portland businesses are bringing a lot of people from other states. We are out of building lots for larger parcels and multifamily dwellings.”
Hottest Real Estate in Portland
Due to the overall high prices of the housing market, homeowners in East Portland are taking advantage of chance to make a good profit off the high demand, according to Caplener.
Caplener said last year his real estate office for inner Southeast Portland and the Beaumont-Wilshire Neighborhood saw houses in the area stay on the market for an average of ten days.
“The closer you get to the river, the quicker it sells,” Caplener said.
The low availability of homes for sale makes competition intense. A home for sale in Portland will get an average of around two offers. However, some neighborhoods average twice that. Homes for sale in the Brentwood-Darling neighborhood in East Portland get an average of 4.8 offers a piece. Caplener said this puts pressure on the potential buyer.
Milan Cole is one of the owners of JMA Properties, a Portland real estate brokerage.
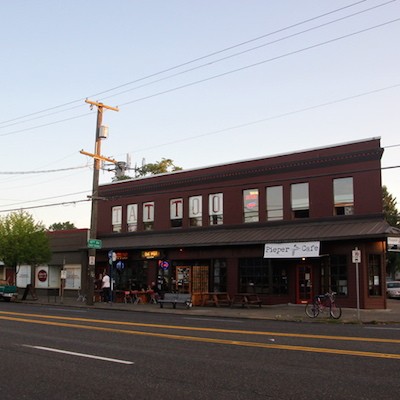
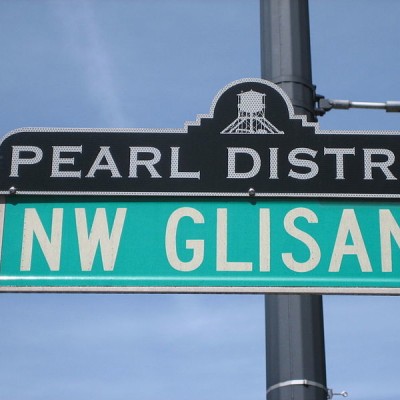
“Inner eastside and inner southeast are where we’ve seen the greatest price appreciate and action since the last real estate crash,” Cole said. “It still provides short commute time to downtown and you still have a home with a back yard and walking to shopping and restaurants.”
The median listing price for a home in Portland is $339,000. Prices are at or close to the highest they have ever been, according to Cole.
However, Portland’s prices are low compared to other nearby metro areas. In Seattle, the median home price is $479,000, while it is $967,000 in San Francisco.
Portland’s population has been steadily increasing over the last few decades. Between 1990 and 2014, the population of the Portland metro area increased by 800,000 people, or 53 percent.
Property Shortage
The rise of the rental and apartment market is contributing to the decline of available homes as well. Arthur Nelson, an associate dean for Architecture and Planning for the University of Arizona, is an expert in real estate analysis. He said Portland has seen an increasing demand for upscale apartments from professionals and senior citizens who prefer renting to buying.
With a focus on multi-family dwellings, few single dwelling homes are being built.
“For every house built there are six apartments for rent. It’s very difficult to rent single family home in today’s market,” Cole said.
Cole said Portland’s rental market in one of the top three highest in country.
Attractive Neighborhoods
Nelson said Southeast Portland streets like Hawthorne are extremely attractive to millennials looking for nicely built homes in neighborhoods close to downtown.
“It’s an interesting sweet spot, with pent up demand for an interesting location,” Nelson said.
Traditionally, neighborhoods east of 82nd Avenue have had had lower property values. The area’s cheaper prices have attracted lower-income residents as an alternative to more expensive areas like Downtown.
Crime is also an issue there, according to an analysis of the city's
most dangerous neighborhoods by GoLocalPDX.
However, Michael Morris, a Portland Redfin agent, said his agency has not seen crime stopping home seekers from searching in East Portland.
“Crime hasn’t been a deterrent. We deal with a large number of buyers and I haven’t had anybody who say’s their worried about crime,” Morris said.
Future Trends
Although Portland’s real estate market may be leaning towards sellers in East Portland now, Nelson said these trends pass or change over time. Nelson said he would be surprised if Portland’s aggressive seller’s market were to last for over two years.
Morris said more development for homeownership properties could help lower prices, but the influx of buyers and shortages of homes will keep things the same for now.
“More people need to start selling who have been standing on the sidelines for the last five years,” Morris said. “There’s no slow down for the wave of buyers that is going to continue for some time.”
Related Slideshow: Portland’s 20 Hottest Neighborhoods for Real Estate
What are Portland’s hottest neighborhoods for real estate? The 20 neighborhoods below are ranked by the number of sold homes over the last 90 days. The information, along with the median list price and median price per square foot, comes from the real estate company Redfin. The population is from 2010 census data.
The sale to list percentage, also from Redfin, is the final selling price over what the listed price was, to show how close sellers came to their asking price. In cases where it is over 100 percent, the seller got more than then listed price.
Find out what the hottest real estate neighborhoods in Portland are:
Prev
Next
#20 (tied)
# of Homes Sold Over the Last 90 Days: 34
Median List Price: $259,925
Median Price Per Square Foot: $143
Sale to List Percentage: 98.1%
Population: 8,775
Note: Sale to List Percentage shows how close the sale price was to the listed price.
Prev
Next
#19 (tied)
# of Homes Sold Over the Last 90 Days: 34
Median List Price: $489,700
Median Price Per Square Foot: $287
Sale to List Percentage: 98.3%
Population: 8,982
Note: Sale to List Percentage shows how close the sale price was to the listed price.
Prev
Next
#18 (tied)
# of Homes Sold Over the Last 90 Days: 34
Median List Price: $497,000
Median Price Per Square Foot: $345
Sale to List Percentage: 98.9%
Population: 11,607
Note: Sale to List Percentage shows how close the sale price was to the listed price.
Prev
Next
#17
# of Homes Sold Over the Last 90 Days: 36
Median List Price: $394,500
Median Price Per Square Foot: $442
Sale to List Percentage: 97.5%
Population: 12,801
Note: Sale to List Percentage shows how close the sale price was to the listed price.
Prev
Next
#16 (tied)
# of Homes Sold Over the Last 90 Days: 38
Median List Price: $574,900
Median Price Per Square Foot: $356
Sale to List Percentage: 99.2%
Population: 10,162
Note: Sale to List Percentage shows how close the sale price was to the listed price.
Prev
Next
#15 (tied)
# of Homes Sold Over the Last 90 Days: 38
Median List Price: $235,000
Median Price Per Square Foot: $180
Sale to List Percentage: 100.3%
Population: 13,209
Note: Sale to List Percentage shows how close the sale price was to the listed price.
Prev
Next
#14 (tied)
# of Homes Sold Over the Last 90 Days: 39
Median List Price: $249,974
Median Price Per Square Foot: $178
Sale to List Percentage: 98.7%
Population: 7,397
Note: Sale to List Percentage shows how close the sale price was to the listed price.
_400_400_90.jpg)
Prev
Next
#13 (tied)
# of Homes Sold Over the Last 90 Days: 39
Median List Price: $249,974
Median Price Per Square Foot: $178
Sale to List Percentage: 98.7%
Population: 9,550
Note: Sale to List Percentage shows how close the sale price was to the listed price.
Prev
Next
#12 (tied)
# of Homes Sold Over the Last 90 Days: 42
Median List Price: $234,925
Median Price Per Square Foot: $164
Sale to List Percentage: 97.6%
Population: 12,207
Note: Sale to List Percentage shows how close the sale price was to the listed price.
Prev
Next
#11 (tied)
# of Homes Sold Over the Last 90 Days: 42
Median List Price: $574,950
Median Price Per Square Foot: $361
Sale to List Percentage: 98.2%
Population: 7,088
Note: Sale to List Percentage shows how close the sale price was to the listed price.

Prev
Next
#10
# of Homes Sold Over the Last 90 Days: 43
Median List Price: $225,000
Median Price Per Square Foot: $172
Sale to List Percentage: 101.1%
Population: 9,789
Note: Sale to List Percentage shows how close the sale price was to the listed price.
Prev
Next
#9
# of Homes Sold Over the Last 90 Days: 44
Median List Price: $274,700
Median Price Per Square Foot: $185
Sale to List Percentage: 97.8%
Population (Mount Scott-Arleta): 7,397
Note: Sale to List Percentage shows how close the sale price was to the listed price.
Prev
Next
#8
# of Homes Sold Over the Last 90 Days: 50
Median List Price: $203,000
Median Price Per Square Foot: $153
Sale to List Percentage: 99.6%
Population: 23,662
Note: Sale to List Percentage shows how close the sale price was to the listed price.
Prev
Next
#7
# of Homes Sold Over the Last 90 Days: 51
Median List Price: $500,000
Median Price Per Square Foot: $445
Sale to List Percentage: 98.9%
Population: 5,997
Note: Sale to List Percentage shows how close the sale price was to the listed price.
Prev
Next
#6
# of Homes Sold Over the Last 90 Days: 54
Median List Price: $699,900
Median Price Per Square Foot: $253
Sale to List Percentage: 101.3%
Population: 5,346
Note: Sale to List Percentage shows how close the sale price was to the listed price.
Prev
Next
#5
# of Homes Sold Over the Last 90 Days: 56
Median List Price: $225,000
Median Price Per Square Foot: $166
Sale to List Percentage: 98.3%
Population: 23,462
Note: Sale to List Percentage shows how close the sale price was to the listed price.
Prev
Next
#4
# of Homes Sold Over the Last 90 Days: 58
Median List Price: $184,950
Median Price Per Square Foot: $161
Sale to List Percentage: 99.3%
Population (Brentwood-Darlington): 12,994
Note: Sale to List Percentage shows how close the sale price was to the listed price.
Prev
Next
#3
# of Homes Sold Over the Last 90 Days: 67
Median List Price: $214,950
Median Price Per Square Foot: $164
Sale to List Percentage: 97.9%
Population: 30,639
Note: Sale to List Percentage shows how close the sale price was to the listed price.
Prev
Next
#2
# of Homes Sold Over the Last 90 Days: 67
Median List Price: $222,500
Median Price Per Square Foot: $201
Sale to List Percentage: 100%
Population: 16,287
Note: Sale to List Percentage shows how close the sale price was to the listed price.
Prev
Next
#1
# of Homes Sold Over the Last 90 Days: 81
Median List Price: $212,450
Median Price Per Square Foot: $178
Sale to List Percentage: 99.3%
Population: 12,994
Note: Sale to List Percentage shows how close the sale price was to the listed price.
Enjoy this post? Share it with others.
Email to a friend
Permalink


_80_80_90_c1.jpg)


 Delivered Free Every
Follow us on Pinterest Google + Facebook Twitter See It Read It