Portland’s Principal Shuffle Could Be Affecting Student Success


 Email to a friend
Permalink
Email to a friend
Permalink
Tuesday, May 26, 2015
Rebecca Randall, GoLocalPDX Contributor
The reasons have been varied—from police arrests at school to simply finding best matches—but Portland Public Schools’ pattern of principal shuffling could be affecting student success.
Gwen Sullivan, Portland Association of Teachers president, thinks that school leadership is one indicator of how well schools are doing.
Sullivan isn’t alone in connecting school success to good principal leadership. Similar to beliefs about teacher quality and student performance, federal policies from No Child Left Behind to the current Obama administration have prioritized principal leadership in turning around low-performing schools.
While there are anecdotes that suggest the importance of principal leadership, a 2013 study published in Education Next is attempting to provide more evidence that it really does. The researchers, Gregory Branch, Eric Hanushek, and Steven Rivkin, compare school performance in Texas schools with principal leadership.
They wrote, “Our results indicate that highly effective principals raise the achievement of a typical student in their schools by between two and seven months of learning in a single school year; ineffective principals lower achievement by the same amount.”
While principal leadership could be key in improving schools, the study’s authors acknowledge that there are many factors that affect achievement, including parent involvement and the affluence of the community, which make it difficult to quantify the connection.
For Sullivan, though, the issue is whether teachers and principals are on the same page. It’s when they’re not that she fears school won’t be at their best.
“This is the most amount of principal shuffle I can remember during the middle of the year,” said Sullivan.
Rigler, Glencoe, Richmond, Kelly, James John and Buckman elementary schools have all had principals shuffled in and out this year. So have Scott K-8 and Hosford Middle School.
At some schools, the situation surrounding decisions to move principals has been more public, such as at Rigler and Kelly elementary schools. Willamette Week reported the turnover at Rigler, where teachers organized a complaint to the district about principal Sara Gandarilla who then abruptly went on medical leave. It also reported the arrest of Marti Diaz, principal at Kelly, for domestic violence.
In some schools, the teachers are clearly unhappy with the leadership, according to the Teaching Empowering Leading and Learning (TELL) survey.
The TELL survey, which is provided by the New Teachers Center, is administered statewide with the support of the Oregon Department of Education, the Oregon School Boards Association, the Oregon Education Association, and the Confederation of School Administrators.
About fifty-seven percent of Portland teachers voluntarily participated in the lengthy online survey, which asked questions about a range of topics, including instructional practices, managing student conduct, school leadership, professional development and others. The survey is planned for every two years.
The first year of the survey was 2013-2014, so it can’t speak to leadership during this year, but the results quite drastically show where teachers aren’t confident in their principal’s leadership abilities.
Unfortunately, Kelly Elementary, where Diaz led from 2012 until a few months into the 2014-2015 year, did not get enough respondents to report results. Though at Rigler Elementary, where Gandarilla was not yet principal in 2013-2014, roughly half of teachers took the survey and most were not happy with principal Kristie Lindholm.
Sixty-two percent of respondents either disagreed or strongly disagreed that “the faculty and leadership had a shared vision.” A similar portion—68 percent—also disagreed or strongly disagreed that “there is an atmosphere of trust and mutual respect in this school.”
Beach Elementary, which has seen a pattern of short principal tenure in recent years, had one of the more alarming results on school leadership. Roughly 81 percent of teachers participated and had near consensus on a number of the statements.
Ninety-three percent did not think faculty and leadership have a shared vision or that there was an atmosphere of trust and mutual respect. Additionally 96 percent did not feel comfortable raising issues of concern and did not believe that school leadership supports teachers.
During the year of the survey, Rebecca Torres-Wilhelm worked as principal of Beach. Torres-Wilhelm’s leadership inspired a parent petition to have her ousted. In 2014-2015, Mary Patterson replaced her as principal, and this fall Cate Boyce will step into the role.
According to Beach’s Oregon Report Card for 2013-2014, the school’s performance falls slightly below the average Oregon school. Sixty-eight percent met or exceeded science, 62.5 percent met or exceeded reading, and 57.2 percent met benchmarks in math. While its Hispanic/Latino students are doing better than the Oregon average, its African-American students are behind by about 15 percentage points, and multi-racial and Native American students are doing even worse.
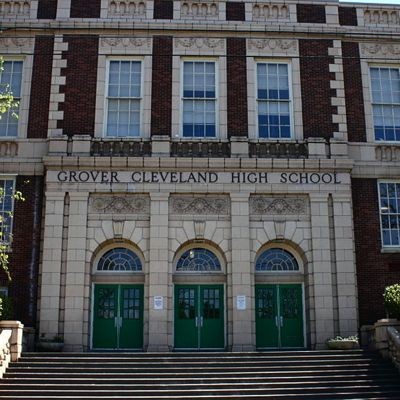
Sullivan noted that one of the best results for school leadership was Cleveland High School. At Cleveland, 64 percent of teachers responded, three-quarters of which agreed that faculty and school leadership shared the same vision. Over 80 percent also felt respected and felt comfortable sharing concerns with leadership.
At Cleveland, students surpassed the state average on the Oregon Report Card in the same year. In reading, only about seven percent did not pass standards. In math, 81 percent met or exceeded standards; in writing 76 percent; in science about 68 percent. It also has higher graduation rates for students of color, economically disadvantaged students, students with disabilities and English language learners than the rest of the state.
Principal leadership is concerning to Sullivan, who wants to see more teacher involvement in selecting principals. “Teachers want a role in principal selection,” she said saying that having a transparent process will lead to a shared vision, which leads to successful schools.
The district hasn’t been very inclusive in its approach to addressing what has been a persistent problem, she said. In 2011, Senate Bill 290 attempted to strengthen educator evaluations, which led to Portland Public Schools working with the teacher’s union on developing framework for teacher’s evaluations. It is also supposed to be working with the union on principal evaluations, said Sullivan, yet she has no idea where they are on that.
“Every school has its own sort of vision and climate and you want someone who supports that,” she said.
According to Branch, Hanushek and Rivkin’s study, a lack of good performance measures for principals is especially concerning for schools serving disadvantaged students. “This is troubling, as the demands of leading such schools, including the need to attract and retain high-quality teachers despite less desirable working conditions, may amplify the importance of having an effective leader,” they wrote.
Related Slideshow: Top 100 Oregon High Schools
GoLocalPDX has ranked high schools across the state based on a method developed at Babson College, Mass. See below for the top 100 schools in the Beaver State.

Prev
Next
#100
South Albany High School
Greater Albany Public School District
Enrollment: 1260
Economically disadvantaged: 55%
Met or exceeded reading standards: 86.9%
Met or exceeded math standards: 65.5%
Met or exceeded writing standards: 68.1%
Met or exceeded science standards: 54.6%
Four year graduation rate: 76.2%
Photo Credit: kamera kızı via Compfight cc

Prev
Next
#99
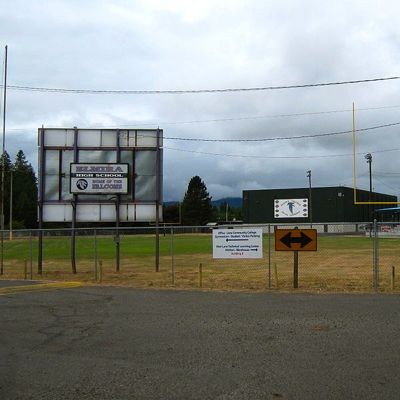
Yamhill Carlton High
Yamhill Carlton School District
Enrollment: 375
Economically disadvantaged: 32%
Met or exceeded reading standards: 93.8%
Met or exceeded math standards: 60.8%
Met or exceeded writing standards: 47.9%
Met or exceeded science standards: 69.6%
Four year graduation rate: 83.8%

Prev
Next
#98
Phoenix High
Phoenix-Talent School District
Enrollment: 695
Economically disadvantaged: 54%
Met or exceeded reading standards: 88.3%
Met or exceeded math standards: 74.7%
Met or exceeded writing standards: 64%
Met or exceeded science standards: 56.4%
Four year graduation rate: 70.6%
Prev
Next
#97
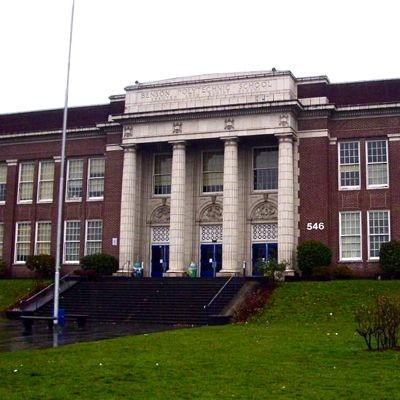
Benson Polytechnic High
Portland School District
Enrollment: 819
Economically disadvantaged: 68%
Met or exceeded reading standards: 87.1%
Met or exceeded math standards: 75.9%
Met or exceeded writing standards: 40.8%
Met or exceeded science standards: 84%
Four year graduation rate: 82.2%
Prev
Next
#96
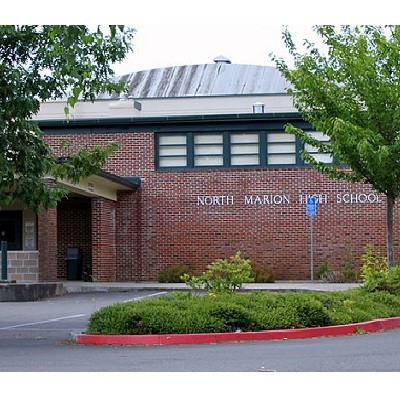
North Marion High
North Marion School District
Enrollment: 588
Economically disadvantaged: 62%
Met or exceeded reading standards: 86.3%
Met or exceeded math standards: 64.9%
Met or exceeded writing standards: 58.6%
Met or exceeded science standards: 58.5%
Four year graduation rate: 87.6%

Prev
Next
#95
Hidden Valley High
Three Rivers/Josephine County School District
Enrollment: 681
Economically disadvantaged: 53%
Met or exceeded reading standards: 83.7%
Met or exceeded math standards: 71.4%
Met or exceeded writing standards: 52.2%
Met or exceeded science standards: 66.7%
Four year graduation rate: 68.3%
Photo Credit: dcJohn via Compfight cc
Photo Credit: sleepyneko via Compfight cc

Prev
Next
#94
North Valley High
Three Rivers/Josephine County School District
Enrollment: 522
Economically disadvantaged: 51%
Met or exceeded reading standards: 89.2
Met or exceeded math standards: 56%
Met or exceeded writing standards: 46.8%
Met or exceeded science standards: 72.2%
Four year graduation rate: 68.3%
Photo Credit: naosuke ii via Compfight cc
Photo Credit: peteoshea via Compfight cc

Prev
Next
#93
Stayton High
North Santiam School District
Enrollment: 749
Economically disadvantaged: 48%
Met or exceeded reading standards: 85.3%
Met or exceeded math standards: 68.9%
Met or exceeded writing standards: 56.8%
Met or exceeded science standards: 70.6%
Four year graduation rate: 70.1%
Photo Credit: katerha via Compfight cc
Prev
Next
#92
Liberty High
Hillsboro School District
Enrollment: 1386
Economically disadvantaged: 46%
Met or exceeded reading standards: 89.8%
Met or exceeded math standards: 76%
Met or exceeded writing standards: 53.3%
Met or exceeded science standards: 65.8%
Four year graduation rate: 79.6%
Photo Credit: Aboutmovies, CC

Prev
Next
#91
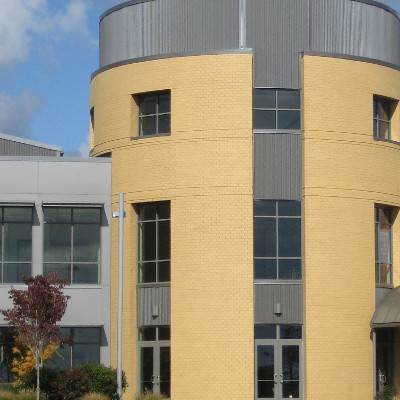
Academy of Arts and Academics
Springfield School District
Enrollment: 280
Economically disadvantaged: 49%
Met or exceeded reading standards: 90.7%
Met or exceeded math standards: 57.4%
Met or exceeded writing standards: 65.4%
Met or exceeded science standards: 73.6%
Four year graduation rate: 84.1%
Prev
Next
#90
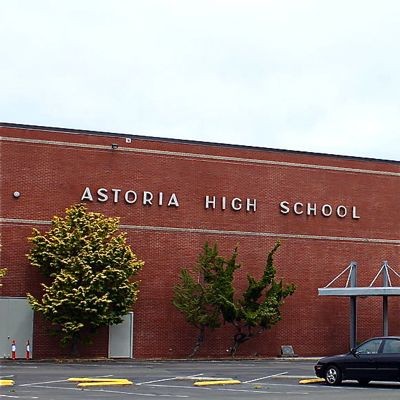
Astoria Senior High
Astoria School District
Enrollment: 572
Economically disadvantaged: 48%
Met or exceeded reading standards: 93.1%
Met or exceeded math standards: 73.8%
Met or exceeded writing standards: 74.3%
Met or exceeded science standards: 52.7%
Four year graduation rate: 59.9%

Prev
Next
#89
Crane Union high School
Harney County Union High School District
Enrollment: 69
Economically disadvantaged: 39%
Met or exceeded reading standards: 97.5%
Met or exceeded math standards: 97.5%
Met or exceeded writing standards: 52.2%
Met or exceeded science standards: 69.6%
Four year graduation rate: 95%

Prev
Next
#88
Vale High
Vale School District
Enrollment: 234
Economically disadvantaged: 52%
Met or exceeded reading standards: 84.6%
Met or exceeded math standards: 64.6%
Met or exceeded writing standards: 63.1%
Met or exceeded science standards: 81.5%
Four year graduation rate: 88.2%

Prev
Next
#87
Gold Beach High
Central Curry School District
Enrollment: 173
Economically disadvantaged: 57%
Met or exceeded reading standards: 91.9%
Met or exceeded math standards: 81.1%
Met or exceeded writing standards: 62.2%
Met or exceeded science standards: 80.8%
Four year graduation rate: 56.7%
Photo Credit: Google
Prev
Next
#86
Dallas High
Dallas School District
Enrollment: 979
Economically disadvantaged: 35%
Met or exceeded reading standards: 84.4%
Met or exceeded math standards: 72.8%
Met or exceeded writing standards: 49%
Met or exceeded science standards: 69.8%
Four year graduation rate: 52.9%
Photo Credit: Tedder - Own work. Licensed under CC BY 3.0 via Wikimedia Commons.
Prev
Next
#85
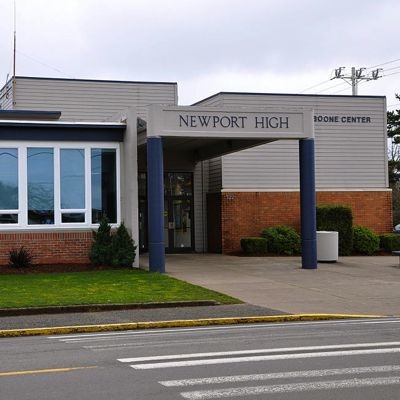
Newport High School
Lincoln County School District
Enrollment: 528
Economically disadvantaged: 43%
Met or exceeded reading standards: 91.7%
Met or exceeded math standards: 81.7%
Met or exceeded writing standards: 62.6%
Met or exceeded science standards: 57.8%
Four year graduation rate: 70.7%
Photo Credit: Finetooth - Own work. Licensed under CC BY-SA 3.0 via Wikimedia Commons.
Prev
Next
#84
LaPine Senior High
Bend-LaPine School District
Enrollment: 439
Economically disadvantaged: 63%
Met or exceeded reading standards: 88.9%
Met or exceeded math standards: 72.4%
Met or exceeded writing standards: 47.5%
Met or exceeded science standards: 62.2%
Four year graduation rate: 74.7%
Photo Credit: samantha celera via Compfight cc

Prev
Next
#83
Aloha High
Beaverton School District
Enrollment: 1962
Economically disadvantaged: 61%
Met or exceeded reading standards: 82.7%
Met or exceeded math standards: 64.5%
Met or exceeded writing standards: 62.2%
Met or exceeded science standards: 60.2%
Four year graduation rate: 72.7%

Prev
Next
#82
La Grande High
La Grande School District
Enrollment: 560
Economically disadvantaged: 37%
Met or exceeded reading standards: 84.3%
Met or exceeded math standards: 60%
Met or exceeded writing standards: 56.4%
Met or exceeded science standards: 59.4%
Four year graduation rate: 74.1%
Photo Credit: Fiorenza Thompson via Compfight cc
Prev
Next
#81
Yoncalla High
Yoncalla School District
Enrollment: 87
Economically disadvantaged: 70%
Met or exceeded reading standards: 97.5%
Met or exceeded math standards: 58.8%
Met or exceeded writing standards: 64.7%
Met or exceeded science standards: 52.9%
Four year graduation rate: 78.8%
Visitor7 - Own work. Licensed under CC BY-SA 3.0 via Wikimedia Commons.
Prev
Next
#80
Elmira High
Fern Ridge School District
Enrollment: 436
Economically disadvantaged: 52%
Met or exceeded reading standards: 88.7%
Met or exceeded math standards: 70.1%
Met or exceeded writing standards: 63.5%
Met or exceeded science standards: 66.7%
Four year graduation rate: 77.6%
Photo Credit: Katr67 - Own work. Licensed under Public domain via Wikimedia Commons.
Prev
Next
#79
Churchill High
Eugene School District
Enrollment: 1020
Economically disadvantaged: 44%
Met or exceeded reading standards: 82.5%
Met or exceeded math standards: 73.6%
Met or exceeded writing standards: 68.8%
Met or exceeded science standards: 61.3%
Four year graduation rate: 69.2%
Photo Credit: EvelynGiggles via Compfight cc
Prev
Next
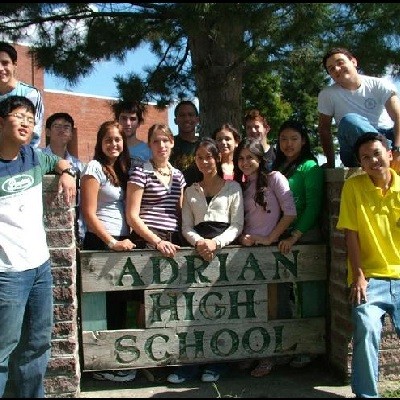
#78
Adrian High
Adrian School District
Enrollment: 64
Economically disadvantaged: 55%
Met or exceeded reading standards: 97.5%
Met or exceeded math standards: 57.1%
Met or exceeded writing standards: 71.4%
Met or exceeded science standards: 57.1%
Four year graduation rate: 95.5%
Prev
Next
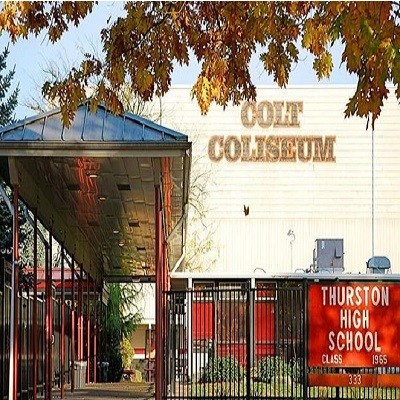
#77
Thurston High
Springfield School District
Enrollment: 1387
Economically disadvantaged: 42%
Met or exceeded reading standards: 85%
Met or exceeded math standards: 68.8%
Met or exceeded writing standards: 73.4%
Met or exceeded science standards: 57.6%
Four year graduation rate: 74.9%

Prev
Next
#76
North Medford High
Medford School District
Enrollment: 1612
Economically disadvantaged: 50%
Met or exceeded reading standards: 89.6%
Met or exceeded math standards: 74.6%
Met or exceeded writing standards: 55.1%
Met or exceeded science standards: 73.9%
Four year graduation rate: 68%
Photo Credit: theilr via Compfight cc

Prev
Next
#75
Klamath Union High
Klamath Falls City School District
Enrollment: 663
Economically disadvantaged: 56%
Met or exceeded reading standards: 81.9%
Met or exceeded math standards: 69.5%
Met or exceeded writing standards: 40.2%
Met or exceeded science standards: 54.8%
Four year graduation rate: 83.4%
Photo Credit: User:bobjgalindo - Own work. Licensed under CC BY-SA 3.0 via Wikimedia Commons.

Prev
Next
#74
Sandy High
Oregon Trail School District
Enrollment: 1286
Economically disadvantaged: 36%
Met or exceeded reading standards: 86.4%
Met or exceeded math standards: 69%
Met or exceeded writing standards: 59%
Met or exceeded science standards: 71.6%
Four year graduation rate: 76%

Prev
Next
#73
Henley High
Klamath County School District
Enrollment: 608
Economically disadvantaged: 33%
Met or exceeded reading standards: 86.7%
Met or exceeded math standards: 74.7%
Met or exceeded writing standards: 54.7%
Met or exceeded science standards: 64.7%
Four year graduation rate: 84.9%

Prev
Next
#72
Pendleton High
Pendleton School District
Enrollment: 881
Economically disadvantaged: 43%
Met or exceeded reading standards: 88.8%
Met or exceeded math standards: 82.7%
Met or exceeded writing standards: 49.7%
Met or exceeded science standards: 61.2%
Four year graduation rate: 75.5%
Prev
Next
#71
Cottage Grove High
South Lane School District
Enrollment: 761
Economically disadvantaged: 59%
Met or exceeded reading standards: 90.4%
Met or exceeded math standards: 70.9%
Met or exceeded writing standards: 54.6%
Met or exceeded science standards: 64%
Four year graduation rate: 87.6%
Photo Credit: Visitor7 - Own work. Licensed under CC BY-SA 3.0 via Wikimedia Commons.
Prev
Next
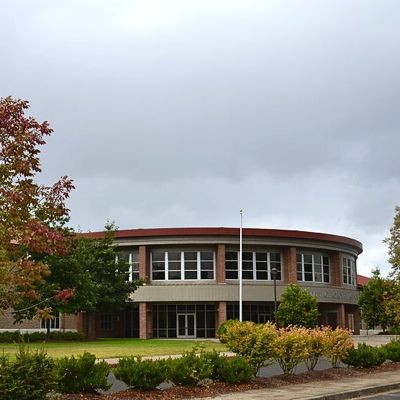
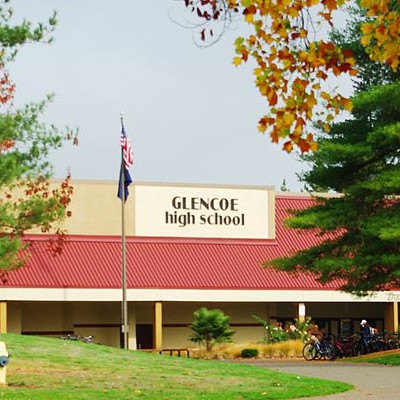
#70
Glencoe High
Hillsboro School District
Enrollment: 1601
Economically disadvantaged: 39%
Met or exceeded reading standards: 88.3%
Met or exceeded math standards: 70.5%
Met or exceeded writing standards: 58.4%
Met or exceeded science standards: 69.9%
Four year graduation rate: 77.1%
Prev
Next
#69
McKenzie High
McKenzie School District
Enrollment: 67
Economically disadvantaged: 61%
Met or exceeded reading standards: 91.7%
Met or exceeded math standards: 41.7%
Met or exceeded writing standards: 50%
Met or exceeded science standards: 83.3%
Four year graduation rate: 68%
Photo Credit: Tedder - Own work. Licensed under CC BY 3.0 via Wikimedia Commons.

Prev
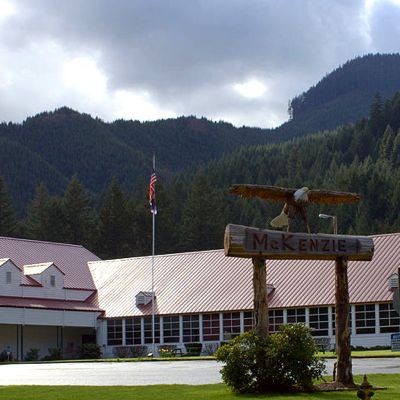
Next
#68
St. Helens High
St. Helens School District
Enrollment: 974
Economically disadvantaged: 36%
Met or exceeded reading standards: 91.4%
Met or exceeded math standards: 72.4%
Met or exceeded writing standards: 59.2%
Met or exceeded science standards: 66%
Four year graduation rate: 75.7%
Photo Credit: M.O. Stevens - Own work. Licensed under CC BY-SA 3.0 via Wikimedia Commons.
Prev
Next
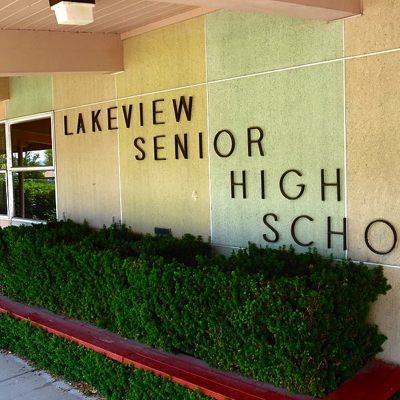
#67
Lakeview Senior High
Lake County School District
Enrollment: 223
Economically disadvantaged: 45%
Met or exceeded reading standards: 87.8%
Met or exceeded math standards: 69.4%
Met or exceeded writing standards: 66.7%
Met or exceeded science standards: 73.5%
Four year graduation rate: 88.1%
Prev
Next
#66
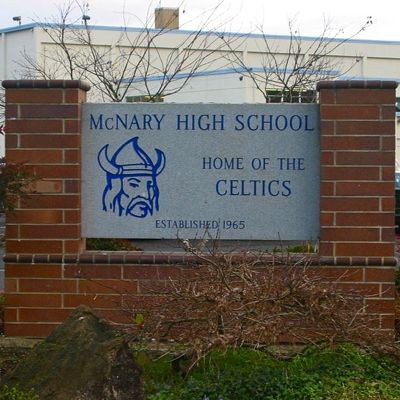
McNary High
Salem-Keizer School District
Enrollment: 1924
Economically disadvantaged: 49%
Met or exceeded reading standards: 89.8%
Met or exceeded math standards: 75%
Met or exceeded writing standards: 59.5%
Met or exceeded science standards: 66.1%
Four year graduation rate: 82%

Prev
Next
#65
Banks High
Banks School District
Enrollment: 384
Economically disadvantaged: 23%
Met or exceeded reading standards: 91.5%
Met or exceeded math standards: 79.8%
Met or exceeded writing standards: 57.4%
Met or exceeded science standards: 81.1%
Four year graduation rate: 80.6%
Photo Credit: valakirka via Compfight cc

Prev
Next
#64
Clackamas Middle College
North Clackamas School District
Enrollment: 290
Economically disadvantaged: 28%
Met or exceeded reading standards: 91.4%
Met or exceeded math standards: 76.3%
Met or exceeded writing standards: 59.3%
Met or exceeded science standards: 78%
Four year graduation rate: 32.6%
Photo Credit: slightly everything via Compfight cc

Prev
Next
#63
South Medford High
Medford School District
Enrollment: 1698
Economically disadvantaged: 56%
Met or exceeded reading standards: 87.9%
Met or exceeded math standards: 76.8%
Met or exceeded writing standards: 61.7%
Met or exceeded science standards: 71.2%
Four year graduation rate: 80.4%
Photo Credit: @RunRockPrincess via Compfight cc
Prev
Next
#62
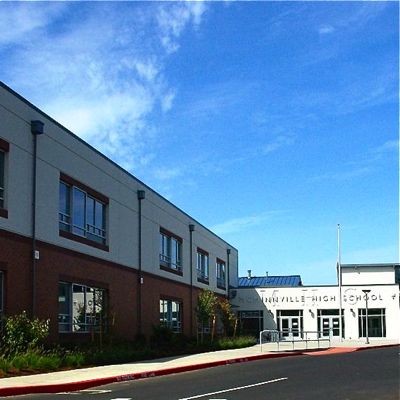
McMinnville High
McMinnville School District
Enrollment: 1864
Economically disadvantaged: 48%
Met or exceeded reading standards: 91.1%
Met or exceeded math standards: 73.3%
Met or exceeded writing standards: 66%
Met or exceeded science standards: 64.6%
Four year graduation rate: 77.1%
Prev
Next
#61
Estacada High
Estacada School District
Enrollment: 589
Economically disadvantaged: 46%
Met or exceeded reading standards: 89.9%
Met or exceeded math standards: 77.7%
Met or exceeded writing standards: 59%
Met or exceeded science standards: 66.4%
Four year graduation rate: 71.8%

Prev
Next
#60
Philomath High
Philomath School District
Enrollment: 519
Economically disadvantaged: 29%
Met or exceeded reading standards: 82.8%
Met or exceeded math standards: 75%
Met or exceeded writing standards: 56.3%
Met or exceeded science standards: 69.5%
Four year graduation rate: 75%

Prev
Next
#59
Weston-McEwen High
Athena-Weston School District
Enrollment: 164
Economically disadvantaged: 33%
Met or exceeded reading standards: 97.5%
Met or exceeded math standards: 61.1%
Met or exceeded writing standards: 76.5%
Met or exceeded science standards: 47.2%
Four year graduation rate: 75.7%
Prev
Next
#58
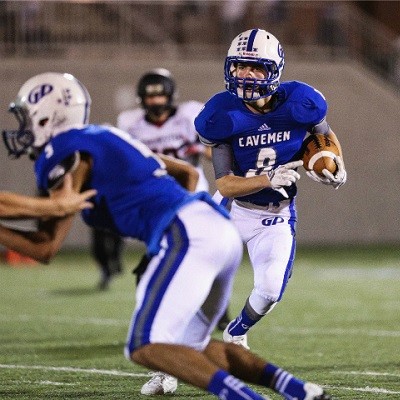
Grants Pass High
Grants Pass School District
Enrollment: 1734
Economically disadvantaged: 55%
Met or exceeded reading standards: 90.3%
Met or exceeded math standards: 68.8%
Met or exceeded writing standards: 68.3%
Met or exceeded science standards: 72.3%
Four year graduation rate: 69%

Prev
Next
#57
North Eugene High
Eugene School District
Enrollment: 927
Economically disadvantaged: 54%
Met or exceeded reading standards: 88.1%
Met or exceeded math standards: 71.2%
Met or exceeded writing standards: 68.3%
Met or exceeded science standards: 63%
Four year graduation rate: 70.7%
Prev
Next
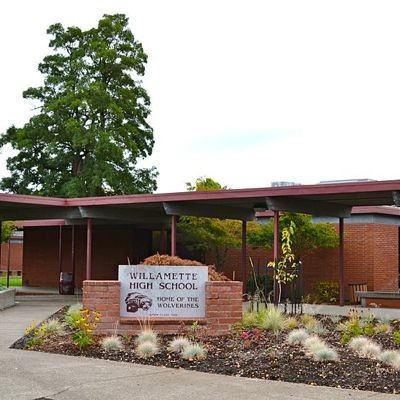
#56
Willamette High
Bethel School District
Enrollment: 1452
Economically disadvantaged: 48%
Met or exceeded reading standards: 89.6%
Met or exceeded math standards: 69.5%
Met or exceeded writing standards: 77.1%
Met or exceeded science standards: 68.2%
Four year graduation rate: 73%

Prev
Next
#55
Putnam High
North Clackamas School District
Enrollment: 1196
Economically disadvantaged: 39%
Met or exceeded reading standards: 88.6%
Met or exceeded math standards: 73.4%
Met or exceeded writing standards: 69.9%
Met or exceeded science standards: 59.3%
Four year graduation rate: 75.7%

Prev
Next
#54
Neah-Kah-Nie High
Neah-Kah Nie School District
Enrollment: 181
Economically disadvantaged: 54%
Met or exceeded reading standards: 83.7%
Met or exceeded math standards: 58.5%
Met or exceeded writing standards: 41.9%
Met or exceeded science standards: 97.5%
Four year graduation rate: 87.5%
Photo Credit: albertogp123 via Compfight cc
Prev
Next
#53
Scappoose High
Scappoose School District
Enrollment: 692
Economically disadvantaged: 28%
Met or exceeded reading standards: 89.6%
Met or exceeded math standards: 85.2%
Met or exceeded writing standards: 54.6%
Met or exceeded science standards: 84.4%
Four year graduation rate: 80.6%
Prev
Next
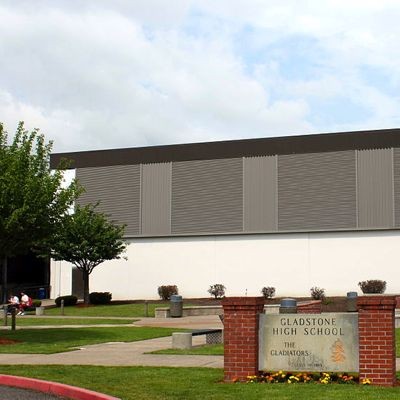
#52
Gladstone High
Gladstone School District
Enrollment: 677
Economically disadvantaged: 40%
Met or exceeded reading standards: 88.7%
Met or exceeded math standards: 77.5%
Met or exceeded writing standards: 66%
Met or exceeded science standards: 82.2%
Four year graduation rate: 78.9%
Prev
Next
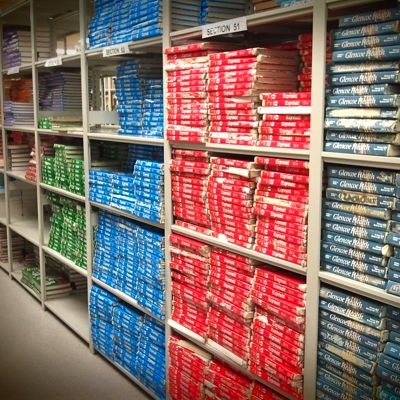
#51
Franklin High
Portland School District
Enrollment: 1387
Economically disadvantaged: 56%
Met or exceeded reading standards: 89.2%
Met or exceeded math standards: 77.7%
Met or exceeded writing standards: 68.1%
Met or exceeded science standards: 59.8%
Four year graduation rate: 78.4%
Prev
Next
#50
Seaside High
Seaside High School
Enrollment: 453
Economically disadvantaged: 52%
Met or exceeded reading standards: 91.2%
Met or exceeded math standards: 70.3%
Met or exceeded writing standards: 60.8%
Met or exceeded science standards: 65.3%
Four year graduation rate: 69.5%

Prev
Next
#49
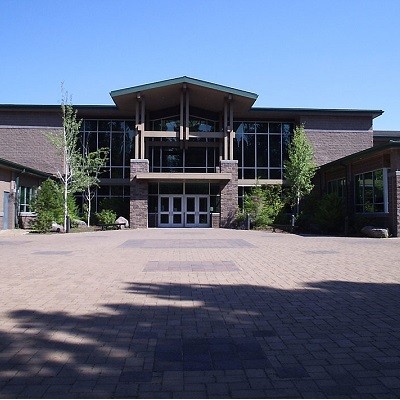
Siuslaw High
Siuslaw School District
Enrollment: 409
Economically disadvantaged: 53%
Met or exceeded reading standards: 89.4%
Met or exceeded math standards: 65.1
Met or exceeded writing standards: 73.3%
Met or exceeded science standards: 77.1%
Four year graduation rate: 65.9%
_400_400_90.JPG)
Prev
Next
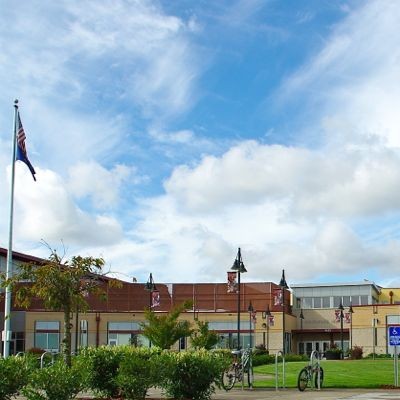
#48
Century High
Hillsboro School District
Enrollment: 1608
Economically disadvantaged: 43%
Met or exceeded reading standards: 87.8
Met or exceeded math standards: 78.6%
Met or exceeded writing standards: 62.7%
Met or exceeded science standards: 72.9%
Four year graduation rate: 84.8%

Prev
Next
#47
Junction City High
Junction City School District
Enrollment: 532
Economically disadvantaged: 54%
Met or exceeded reading standards: 85.6%
Met or exceeded math standards: 76.8%
Met or exceeded writing standards: 56.8%
Met or exceeded science standards: 64.8%
Four year graduation rate: 65.1%
Photo Credit: crazytales562 via Compfight cc
Prev
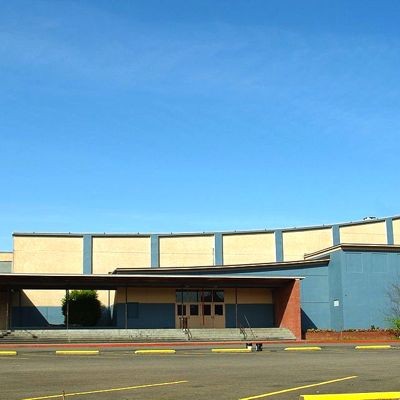
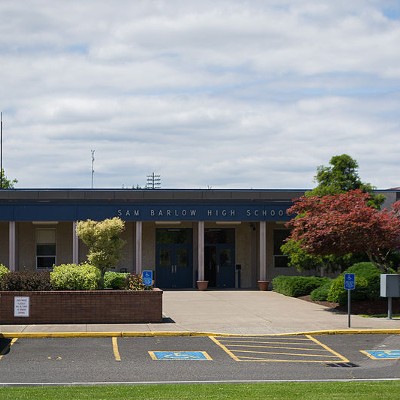
Next
#46
Sam Barlow High
Gresham-Barlow School District
Enrollment: 1651
Economically disadvantaged: 38%
Met or exceeded reading standards: 84.5%
Met or exceeded math standards: 78.4%
Met or exceeded writing standards: 68.8%
Met or exceeded science standards: 76.7%
Four year graduation rate: 81.8%
Prev
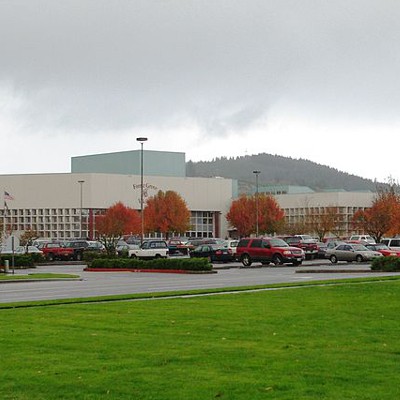
Next
#45
Forest Grove High
Forrest Grove School District
Enrollment: 1779
Economically disadvantaged: 59%
Met or exceeded reading standards: 89.4%
Met or exceeded math standards: 85.7%
Met or exceeded writing standards: 66.6%
Met or exceeded science standards: 61.1%
Four year graduation rate: 72.5%
Prev
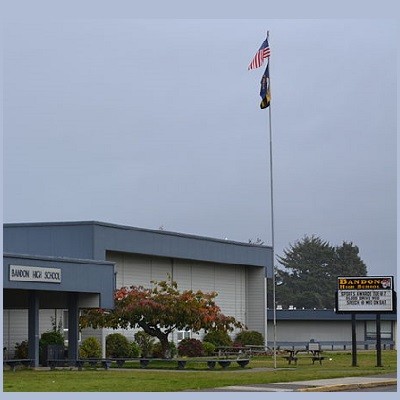
Next
#44
Bandon Senior High
Bandon School District
Enrollment: 242
Economically disadvantaged: 60%
Met or exceeded reading standards: 86.1%
Met or exceeded math standards: 68.1%
Met or exceeded writing standards: 56.3%
Met or exceeded science standards: 70.4%
Four year graduation rate: 72.9%

Prev
Next
#43
South Salem High
Salem-Keizer School District
Enrollment: 1835
Economically disadvantaged: 49%
Met or exceeded reading standards: 89.5%
Met or exceeded math standards: 73.3%
Met or exceeded writing standards: 66.2%
Met or exceeded science standards: 66.5%
Four year graduation rate: 81.9%

Prev
Next
#42
Hood River Valley High
Hood River County School District
Enrollment: 1218
Economically disadvantaged: 57%
Met or exceeded reading standards: 87.1%
Met or exceeded math standards: 78.5%
Met or exceeded writing standards: 69.7%
Met or exceeded science standards: 53.5%
Four year graduation rate: 77.4%

Prev
Next
#41
North Douglas High
North Doughlas School District
Enrollment: 98
Economically disadvantaged: 45%
Met or exceeded reading standards: 91.3%
Met or exceeded math standards: 78.3%
Met or exceeded writing standards: 72.7%
Met or exceeded science standards: 60.9%
Four year graduation rate: 69%

Prev
Next
#40
Baker High
Baker School District
Enrollment: 501
Economically disadvantaged: 47%
Met or exceeded reading standards: 84.6%
Met or exceeded math standards: 73.6%
Met or exceeded writing standards: 65.9%
Met or exceeded science standards: 75.3%
Four year graduation rate: 77.8%
Prev
Next
#39
Oakland High
Oakland School District
Enrollment: 185
Economically disadvantaged: 50%
Met or exceeded reading standards: 91.5
Met or exceeded math standards: 83%
Met or exceeded writing standards: 68.1%
Met or exceeded science standards: 83%
Four year graduation rate: 86.1%
Prev
Next
#38
Newberg Senior High
Newberg School District
Enrollment: 1508
Economically disadvantaged: 42%
Met or exceeded reading standards: 87.9%
Met or exceeded math standards: 77.6%
Met or exceeded writing standards: 71.8%
Met or exceeded science standards: 68.3%
Four year graduation rate: 78.2%

Prev
Next
#37
West Salem High
Salem-Keizer School District
Enrollment: 1646
Economically disadvantaged: 35%
Met or exceeded reading standards: 92.7%
Met or exceeded math standards: 83.5%
Met or exceeded writing standards: 74.6%
Met or exceeded science standards: 74.2%
Four year graduation rate: 86.3%
Prev
Next
#36
Canby High
Canby School District
Enrollment: 1481
Economically disadvantaged: 32%
Met or exceeded reading standards: 87.3%
Met or exceeded math standards: 84%
Met or exceeded writing standards: 71.5%
Met or exceeded science standards: 61.6%
Four year graduation rate: 82.5%

Prev
Next
#35
Burns High
Harney County School District
Enrollment: 208
Economically disadvantaged: 33%
Met or exceeded reading standards: 76.2%
Met or exceeded math standards: 69%
Met or exceeded writing standards: 40.5%
Met or exceeded science standards: 83.3%
Four year graduation rate: 96.2%
Prev
Next
#34
Sheldon High
Eugene School District
Enrollment: 1399
Economically disadvantaged: 29%
Met or exceeded reading standards: 91.4%
Met or exceeded math standards: 77.7%
Met or exceeded writing standards: 69.1%
Met or exceeded science standards: 76.6%
Four year graduation rate: 72.4%
Prev
Next
#33
Oregon City Senior High
Oregon City School District
Enrollment: 2117
Economically disadvantaged: 34%
Met or exceeded reading standards: 97.5%
Met or exceeded math standards: 90.8%
Met or exceeded writing standards: 63%
Met or exceeded science standards: 76.7%
Four year graduation rate: 83%
Prev
Next
#32
Beaverton High
Beaverton School District
Enrollment: 1588
Economically disadvantaged: 43%
Met or exceeded reading standards: 90%
Met or exceeded math standards: 76.7%
Met or exceeded writing standards: 70.7%
Met or exceeded science standards: 65.4%
Four year graduation rate: 74.2%
Prev
Next
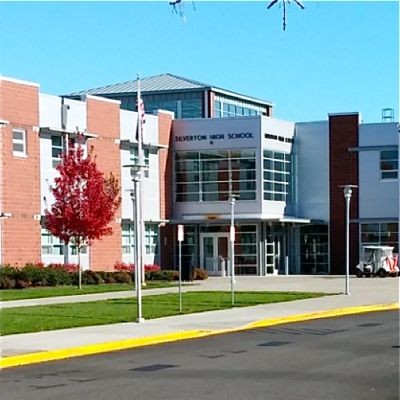
#31
Silverton High
Silver Falls School District
Enrollment: 1179
Economically disadvantaged: 41%
Met or exceeded reading standards: 86.1%
Met or exceeded math standards: 74.1%
Met or exceeded writing standards: 71.9%
Met or exceeded science standards: 72.1 %
Four year graduation rate: 77.7%
Prev
Next
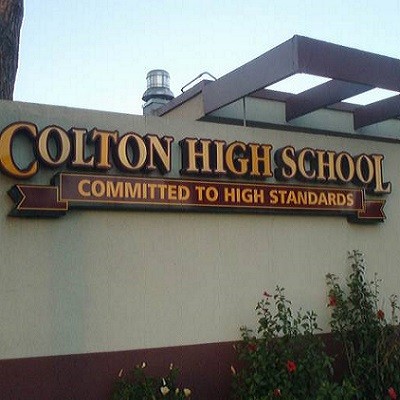
#30
Colton High
Colton School District
Enrollment: 215
Economically disadvantaged: 28%
Met or exceeded reading standards: 90%
Met or exceeded math standards: 76%
Met or exceeded writing standards: 68%
Met or exceeded science standards: 85.1%
Four year graduation rate: 95.2%

Prev
Next
#29
Bend Senior High
Bend-LaPine School District
Enrollment: 1527
Economically disadvantaged: 40%
Met or exceeded reading standards: 92.7%
Met or exceeded math standards: 88.4%
Met or exceeded writing standards: 65.9%
Met or exceeded science standards: 75.6%
Four year graduation rate: 78.7%

Prev
Next
#28
Tualatin High
Tigard-Tualatin School District
Enrollment: 1714
Economically disadvantaged: 27%
Met or exceeded reading standards: 92.2%
Met or exceeded math standards: 76.7%
Met or exceeded writing standards: 62.9%
Met or exceeded science standards: 71.4%
Four year graduation rate: 84.4%

Prev
Next
#27
Mountain View Senior High
Bend-LaPine School District
Enrollment: 1283
Economically disadvantaged: 42%
Met or exceeded reading standards: 93.7%
Met or exceeded math standards: 82%
Met or exceeded writing standards: 75.2%
Met or exceeded science standards: 76.1%
Four year graduation rate: 78.3%
Photo Credit: Vince Kusters via Compfight cc

Prev
Next
#26
Tigard High
Tigard-Tualatin School District
Enrollment: 1835
Economically disadvantaged: 32%
Met or exceeded reading standards: 92.7%
Met or exceeded math standards: 83.5%
Met or exceeded writing standards: 64.5%
Met or exceeded science standards: 67.7%
Four year graduation rate: 80.8%
Prev
Next
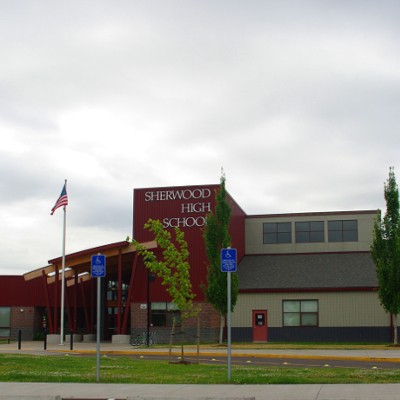
#25
Sherwood High
Sherwood School District
Enrollment: 1469
Economically disadvantaged: 15%
Met or exceeded reading standards: 97.5%
Met or exceeded math standards: 85.8%
Met or exceeded writing standards: 62.2%
Met or exceeded science standards: 84.8%
Four year graduation rate: 91.3%
Prev
Next
#24
Corvallis High
Corvallis School District
Enrollment: 1184
Economically disadvantaged: 32%
Met or exceeded reading standards: 87.5%
Met or exceeded math standards: 79.8%
Met or exceeded writing standards: 69.2%
Met or exceeded science standards: 76.4%
Four year graduation rate: 70.7%

Prev
Next
#23
Sprague High
Salem-Keizer School District
Enrollment: 1608
Economically disadvantaged: 32%
Met or exceeded reading standards: 97.5%
Met or exceeded math standards: 86.2%
Met or exceeded writing standards: 72.5%
Met or exceeded science standards: 79.6%
Four year graduation rate: 82.2%
Photo Credit: Jirka Matousek via Compfight cc
Prev
Next
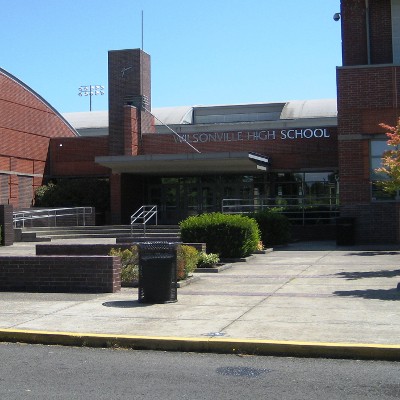
#22
Wilsonville High
West Linn-Wilsonville School District
Enrollment: 1093
Economically disadvantaged: 24%
Met or exceeded reading standards: 92.5%
Met or exceeded math standards: 74.1%
Met or exceeded writing standards: 74.2%
Met or exceeded science standards: 71.3%
Four year graduation rate: 85%

Prev
Next
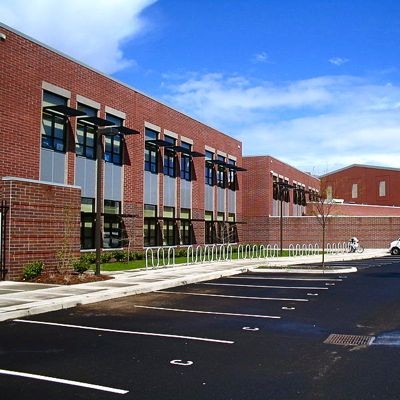
#21
West Albany High
Greater Albany Public School District
Enrollment: 1317
Economically disadvantaged: 28%
Met or exceeded reading standards: 92.3%
Met or exceeded math standards: 87.5%
Met or exceeded writing standards: 75%
Met or exceeded science standards: 84.9%
Four year graduation rate: 93.6%
Photo Credit: jonas maaloe via Compfight cc

Prev
Next
#20
Clackamas High
North Clackamas School District
Enrollment: 2230
Economically disadvantaged: 29%
Met or exceeded reading standards: 91.7%
Met or exceeded math standards: 85.7%
Met or exceeded writing standards: 80.5%
Met or exceeded science standards: 74.2%
Four year graduation rate: 85.5%
Prev
Next
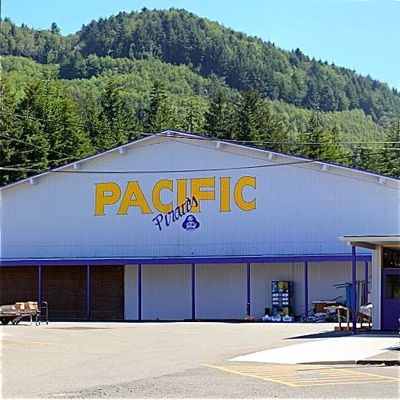
#19
Pacific High
Port Orford-Langlois School District
Enrollment: 90
Economically disadvantaged: 53%
Met or exceeded reading standards: 90.9%
Met or exceeded math standards: 59.1%
Met or exceeded writing standards: 77.3%
Met or exceeded science standards: 68.2%
Four year graduation rate: 78.3%
Photo Credit: Tedder - Own work. Licensed under CC BY 3.0 via Wikimedia Commons.
Prev
Next
#18
Southridge High
Beaverton School District
Enrollment: 1722
Economically disadvantaged: 27%
Met or exceeded reading standards: 91.5%
Met or exceeded math standards: 80.4%
Met or exceeded writing standards: 66.3%
Met or exceeded science standards: 68.9%
Four year graduation rate: 88.5%
Prev
Next
#17
Sisters High
Sisters School District
Enrollment: 480
Economically disadvantaged: 28%
Met or exceeded reading standards: 93.5%
Met or exceeded math standards: 74.1%
Met or exceeded writing standards: 77.8%
Met or exceeded science standards: 83.3%
Four year graduation rate: 88.4%

Prev
Next
#16
Glide High
Glide School District
Enrollment: 215
Economically disadvantaged: 45%
Met or exceeded reading standards: 97.5%
Met or exceeded math standards: 70.8%
Met or exceeded writing standards: 68.8%
Met or exceeded science standards: 93.8%
Four year graduation rate: 86.7%
Photo Credit: racka_abe via Compfight cc

Prev
Next
#15
Summit High
Bend-LaPine School District
Enrollment: 1344
Economically disadvantaged: 22%
Met or exceeded reading standards: 93.3%
Met or exceeded math standards: 74.6%
Met or exceeded writing standards: 73.6%
Met or exceeded science standards: 73.6%
Four year graduation rate: 88.3%
Photo Credit: frankjuarez via Compfight cc

Prev
Next
#14
Grant High
Portland School District
Enrollment: 1489
Economically disadvantaged: 24%
Met or exceeded reading standards: 92.6%
Met or exceeded math standards: 83.3%
Met or exceeded writing standards: 70.3%
Met or exceeded science standards: 66.4%
Four year graduation rate: 84.3%
Prev
Next
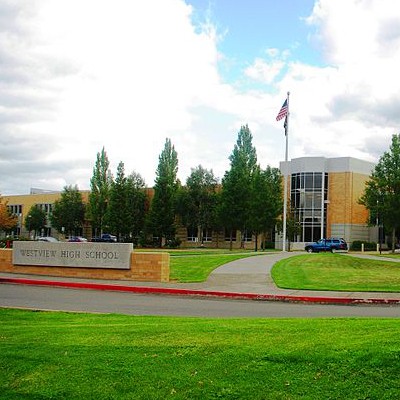
#13
Westview High
Beaverton School District
Enrollment: 2418
Economically disadvantaged: 33%
Met or exceeded reading standards: 92.2%
Met or exceeded math standards: 81.8%
Met or exceeded writing standards: 75.4%
Met or exceeded science standards: 70.3%
Four year graduation rate: 80.1%
Prev
Next
#12
Cleveland High
Portland School District
Enrollment: 1457
Economically disadvantaged: 29%
Met or exceeded reading standards: 92.6%
Met or exceeded math standards: 80.2%
Met or exceeded writing standards: 81.4%
Met or exceeded science standards: 59.7%
Four year graduation rate: 76.2%
Tedder - Own work. Licensed under CC BY 3.0 via Wikimedia Commons.

Prev
Next
#11
Sunset High
Beaverton School District
Enrollment: 1942
Economically disadvantaged: 29%
Met or exceeded reading standards: 94.7%
Met or exceeded math standards: 83.3%
Met or exceeded writing standards: 76.8%
Met or exceeded science standards: 79.7%
Four year graduation rate: 81.4%

Prev
Next
#10
Wilson High
Portland School District
Enrollment: 1185
Economically disadvantaged: 22%
Met or exceeded reading standards: 91.8%
Met or exceeded math standards: 80.4%
Met or exceeded writing standards: 82.8%
Met or exceeded science standards: 63.8%
Four year graduation rate: 84.4%
Photo Credit: KristinNador via Compfight cc

Prev
Next
#9
Ashland High
Ashland School District
Enrollment: 940
Economically disadvantaged: 28%
Met or exceeded reading standards: 97.5%
Met or exceeded math standards: 85.8%
Met or exceeded writing standards: 79.8%
Met or exceeded science standards: 77.2%
Four year graduation rate: 86.1%
Prev
Next
#8
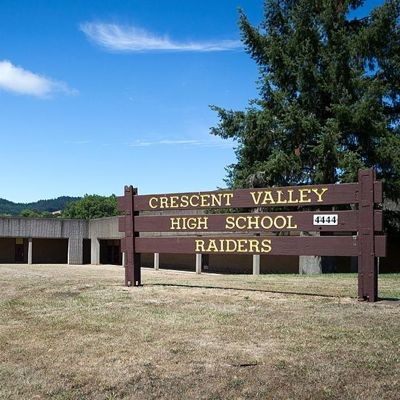
Crescent Valley High
Corvallis School District
Enrollment: 965
Economically disadvantaged: 23%
Met or exceeded reading standards: 97.5%
Met or exceeded math standards: 85.3%
Met or exceeded writing standards: 78.1%
Met or exceeded science standards: 77.8%
Four year graduation rate: 70.1%
Photo Credit: Visitor7 - Own work. Licensed under CC BY-SA 3.0 via Wikimedia Commons.

Prev
Next
#7
West Linn High
West Linn-Wilsonville School District
Enrollment: 1514
Economically disadvantaged: 10%
Met or exceeded reading standards: 97.5%
Met or exceeded math standards: 87.9%
Met or exceeded writing standards: 85.8%
Met or exceeded science standards: 83.2%
Four year graduation rate: 93.2%
Photo Credit: Tedder - Own work. Licensed under CC BY 3.0 via Wikimedia Commons.

Prev
Next
#6
Riverdale High
Riverdale School District
Enrollment: 242
Economically disadvantaged: <6%*
Met or exceeded reading standards: 97.5%
Met or exceeded math standards: 89.8%
Met or exceeded writing standards: 74.6%
Met or exceeded science standards: 74.6%
Four year graduation rate: 94.2%
*numbers less than 6% are represented by an asterisk in the Oregon Department of Education data.

Prev
Next
#5
School of Science & Technology
Beaverton School District
Enrollment: 167
Economically disadvantaged: 20%
Met or exceeded reading standards: 97.5%
Met or exceeded math standards: 97.5%
Met or exceeded writing standards: 86%
Met or exceeded science standards: 63.9%
Four year graduation rate: 81.1%
Photo Credit: Maya83 via Compfight cc
Prev
Next
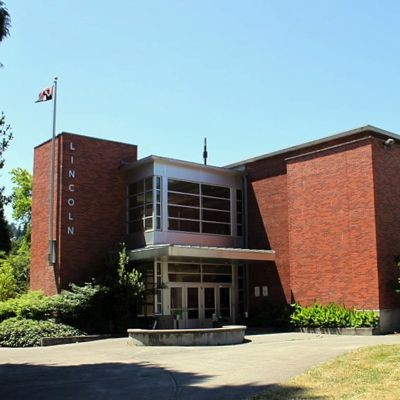
#4
Lincoln High
Portland School District
Enrollment: 1471
Economically disadvantaged: 12%
Met or exceeded reading standards: 92.5%
Met or exceeded math standards: 85.3%
Met or exceeded writing standards: 88.1%
Met or exceeded science standards: 79.9%
Four year graduation rate: 89.3%
Photo Credit: Tedder - Own work. Licensed under CC BY 3.0 via Wikimedia Commons.
Prev
Next
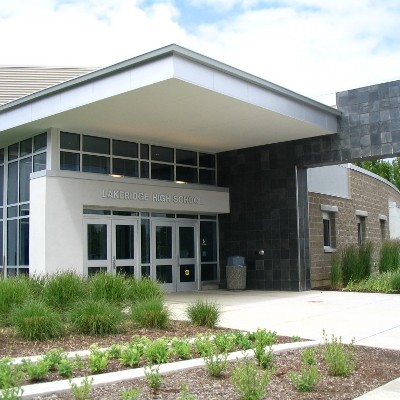
#3
Lakeridge High
Lake Oswego School District
Enrollment: 1078
Economically disadvantaged: 8%
Met or exceeded reading standards: 97.5%
Met or exceeded math standards: 93.9%
Met or exceeded writing standards: 91.8%
Met or exceeded science standards: 92.1%
Four year graduation rate: 89.8%

Prev
Next
#2
South Eugene High
Eugene School District
Enrollment: 1321
Economically disadvantaged: 24%
Met or exceeded reading standards: 97.5%
Met or exceeded math standards: 91.6%
Met or exceeded writing standards: 84.9%
Met or exceeded science standards: 89.2%
Four year graduation rate: 79.4%
Photo Credit: katalicia1 via Compfight cc

Prev
Next
#1
Lake Oswego Senior High
Lake Oswego School District
Enrollment: 1224
Economically disadvantaged: 6%
Met or exceeded reading standards: 97.5%
Met or exceeded math standards: 92.4%
Met or exceeded writing standards: 89.1%
Met or exceeded science standards: 87.7%
Four year graduation rate: 89.5%
Photo Credit: KristinNador via Compfight cc
Enjoy this post? Share it with others.
Email to a friend
Permalink


_80_80_90_c1.JPG)


Follow us on Pinterest Google + Facebook Twitter See It Read It