Portland’s Most Dangerous Neighborhoods


 Email to a friend
Permalink
Email to a friend
Permalink
Wednesday, October 22, 2014
GoLocalPDX News Team
Portland’s most dangerous neighborhoods*, ranked by crime, fire emergencies and the presence of dangerous intersections, are disproportionately clustered in east Portland, according to a GoLocalPDX data analysis.
Taking five years of police and fire data from the city, and combining it with the Oregon Department of Transportation’s ranking on the city’s 60 most dangerous intersections, GoLocalPDX crunched the numbers to see where the dangers lay.
Slideshow Below: Portland’s 35 Most Dangerous Neighborhoods
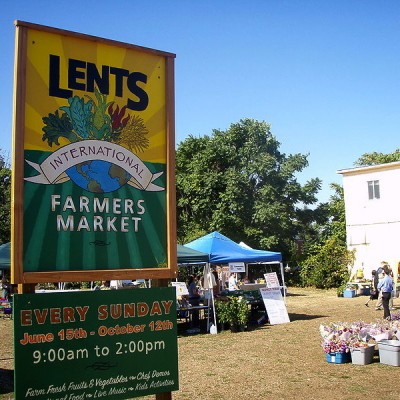
Taken together, five east Portland neighborhoods - Hazelwood, Lents, Powellhurst-Gilbert, Centennial and Montavilla - topped the ranks of most dangerous neighborhoods due to their nexus of high crime, fires and the fact that they are home to some of the city’s deadliest intersections.
GoLocalPDX Method for Ranking Most Dangerous Neighborhoods: Here
Neighborhood leaders in these communities take understandable pride in their areas. Many point to the fact that east Portland has seen massive growth in recent years as poor residents flee from the rapidly gentrifying inner city while City Hall all but neglected the area’s infrastructure. That said, most were optimistic that their advocacy for change and a shifting attitude at City Hall was paying off in improvements in the community.,
Full list of neighborhood rankings: Download
Crime: Downtown, North Portland and east Portland
Crime in downtown Portland gets a lot of media attention. Just this Tuesday, police arrested two suspects in connection with a 43-year-old man who was fatally stabbed downtown the week before.
But over the last five years, east Portland’s Hazelwood neighborhood there were almost 1,000 more calls for police, due to serious and violent crime, than were made downtown. The city classifies crime in clusters, the most serious, are part-one crimes, and includes, murder, rape but also larceny and burglary*.
“We are a big neighborhood,” said Hazelwood neighborhood activist Linda Robinson. She used to be data analyst and research assistant for Portland State University. “We have 23,000 people who live in the neighborhoods.”
Robinson cautioned against reading too much into rankings like GoLocalPDX’s that compare raw data, such as total number of crimes. But the raw numbers generally parallel per capita crime rates.
Hazelwood, with over 23,462 residents covering 2,625 acres, is one of the largest neighborhoods in Portland. The neighborhood has about 2.31 of part-one crimes per person.
Compare that to tiny Eliot Neighborhood in North Portland, (number 15 on the list) with its 3,611 people in 560 acres, which has a part-one rate of 1.86 crimes per person. While Old Town/Chinatown (number 18), with 3,922 people in just 198 acres, has a rate of 1.20 crimes per person.
North Portland had three neighborhoods in the top ranks - Kenton, Portsmouth and St. Johns.
Crime trends in the metro area have been moving east for a decade.
“Certainly we’ve seen a shift in Portland over the years,” said Sgt. Pete Simpson of the Portland police. “Gang activity has shifted from Northeast Portland to east Portland.”
Of the top 35 most dangerous neighborhoods, there are 13 located in east Portland, and nine with over 2,000 calls for police service on serious and violent crime, way above the average for a Portland city neighborhood.
Healy Height’s in Portland’s West Hills, by comparison, was the safest neighborhood in Portland with only 12 calls to police over part-one crimes in five years.
The Mayor’s Office was not immediately available for in-depth comment, but staff stressed that while rates may be higher in one spot of the city or another, overall the violent crime is on a long term decline, both in Portland and around the nation.
“We are at a 50-year low for part one (violent) crimes,” said Dana Haynes, of the Mayor’s Office. “The city is the safest it’s been since the 1960s.”
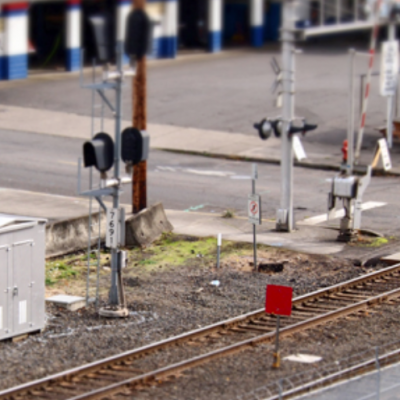
Dangerous Traffic
GoLocalPDX’s ranking used ODOT’s list of the city’s 60 most dangerous intersections to access neighborhood traffic safety. The list is made up of data from 2008 to 2011 and includes crash rates, injuries, fatalities and property damage. Both ODOT and the city use the list to prioritize spending on safety and improvement projects.
Of the three factors that threaten residents in the areas east of 82nd Tim Curran wants traffic addressed most.
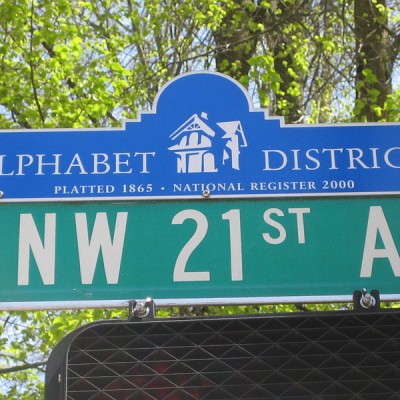
Curran is the publisher of the Mid-county Memo, a community newspaper and website site that covers much of east Portland. Curran grew up in the Alameda Neighborhood and has been an east Portland resident since 2003. He said since Portland annexed the area in the 1980s there have been few road improvements.
“For the last 27 years it’s been ‘You’re on own,’” Curran said of City Hall’s traditional attitude.
The top five most dangerous neighborhoods (all in east Portland) contain a whopping 31 of the city’s 60 most dangerous intersections.
Richard Bixby, director of the city's East Portland Neighborhood Office agrees.
“It’s an old road system meant for fast speeds,” Bixby said. “On Halsey the speed limit is 40 miles an hour. People drive fast and then get into a congested area and you get hit.”
Improvement Slowly Happening
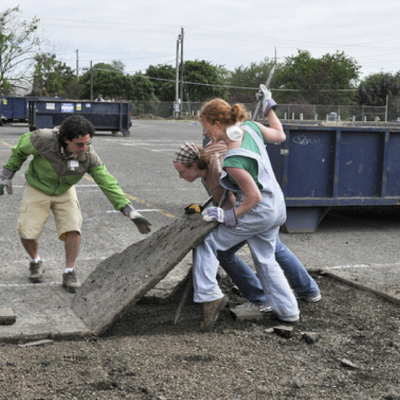
Over the last three years, east Portland has seen improvements to its long list of projects.
Efforts like the East Portland Action Plan and East Portland in Motion have prioritized projects and advocated for things to get done.
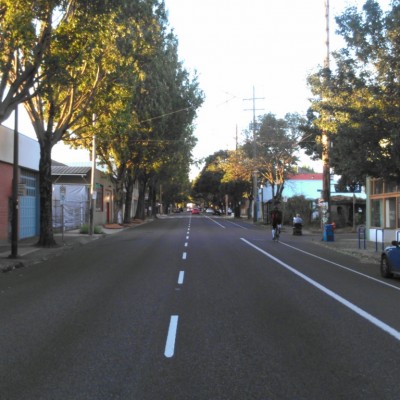
Repaving has happened on 122nd Avenue, improvements have been made to outer Southeast Powell Boulevard and new sidewalks have been installed on Northeast Glisan Street.
Curran recently wrote about 18 newly installed crosswalk beacons.
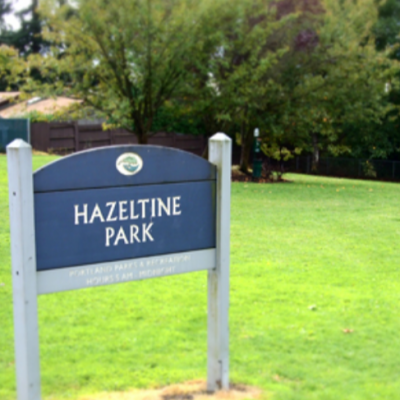
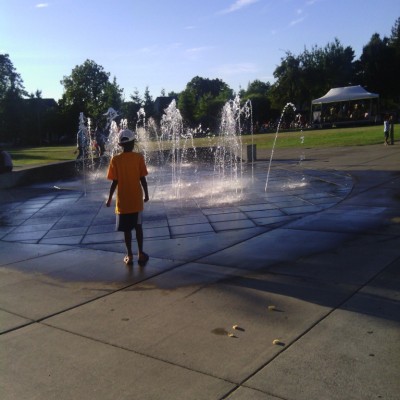
The parks bureau unveiled a plan for the area in 2011, pledged to build 20 acres of new park space and recently refurbished 12 existing ones.
The city has unveiled a raft of new road improvement projects from a Foster Streetscape Plan to transit improvements plans for Southeast Powell Boulevard.
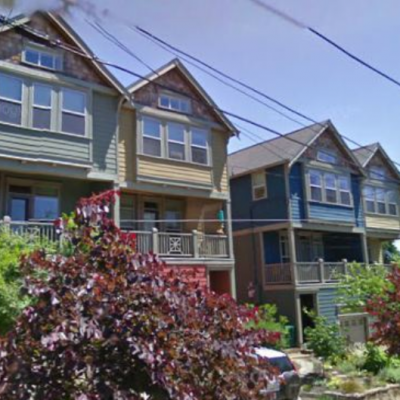
Even new middle-class homebuyers are starting to trickle into neighborhoods like Lents, Gateway and Parkrose.
Robinson, a retiree, has been involved with her neighborhood for almost 20 years. She said progress is slow, but building momentum and that’s what keeps her going as an activist.
“You make small improvements and then people see that they can make a difference.”
----
*Part one crime is a category of crime that includes, assault, arson, burglary, homicide, larceny, rape, robbery, theft from vehicle, and vehicle theft.
Related Slideshow: Portland’s 35 Most Dangerous Neighborhoods
* Rankings have been adjusted since their original posting to better reflect all neighborhood boundaries that make contact with the city's most dangerous intersections.
Prev
Next
#35
Buckman-East
Calls for police: 1,714
Fire incidents: 162
City's most dangerous intersections: none
*Police stats are violent crimes only. Both police and fire stats represent totals for five years
Prev
Next
#34
Overlook
Calls for police: 1,792
Fire incidents: 139
City's most dangerous intersections: none
*Police stats are violent crimes only. Both police and fire stats represent totals for five years
Prev
Next
#33
King
Calls for police: 1,431
Fire incidents: 115
City's most dangerous intersections:
- Northeast Killingsworth St./ Northeast Martin Luther King Jr. Blvd. Total crashes: 57
*Police stats are violent crimes only. Both police and fire stats represent totals for five years
Prev
Next
#32
Buckman-West
Calls for police: 2,547
Fire incidents: 213
City's most dangerous intersections: none
*Police stats are violent crimes only. Both police and fire stats represent totals for five years
Prev
Next
#31
Kerns
Calls for police: 1,853
Fire incidents: 165
City's most dangerous intersections: none
*Police stats are violent crimes only. Both police and fire stats represent totals for five years
Prev
Next
#30
Hosford-Abernethy
Calls for police: 2,248
Fire incidents: 126
City's most dangerous intersections:
- Southeast 7th Ave./ Southeast Powell Blvd. Total crashes: 114
*Police stats are violent crimes only. Both police and fire stats represent totals for five years
Prev
Next
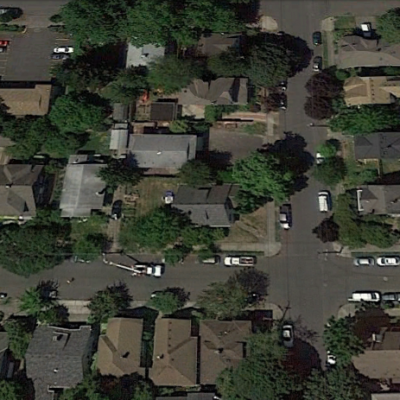
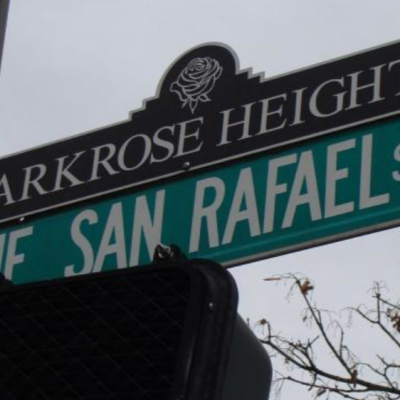
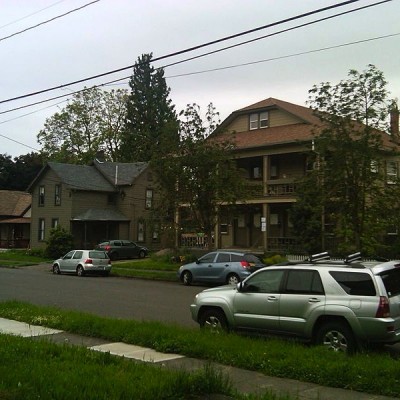
#29
Parkrose Heights
Calls for police: 1,064
Fire incidents: 86
City's most dangerous intersections:
- Northeast 122nd Ave./ Northeast Halsey St. Total crashes: 99
- Northeast 102nd Ave./ Northeast Halsey St. Total crashes: 56
*Police stats are violent crimes only. Both police and fire stats represent totals for five years
Prev
Next
#28
Creston-Kenilworth
Calls for police: 1,750
Fire incidents: 133
City's most dangerous intersections:
- Southeast Cesar E Chavez Blvd. / Southeast Powell Blvd.Total crashes: 104
- Southeast 50th Ave. / Southeast Foster Rd. / Southeast Powell Blvd. Total crashes: 53
*Police stats are violent crimes only. Both police and fire stats represent totals for five years
Prev
Next
#27
Hayden Island
Calls for police: 2,043
Fire incidents: 136
City's most dangerous intersections: none
*Police stats are violent crimes only. Both police and fire stats represent totals for five years
Prev
Next
#26
Wilkes
Calls for police: 1,269
Fire incidents: 102
City's most dangerous intersections: none
*Police stats are violent crimes only. Both police and fire stats represent totals for five years
Prev
Next
#25
Pleasant Valley
Calls for police: 1,102
Fire incidents: 89
City's most dangerous intersections:
- Southeast 174th Ave./ Southeast Powell Blvd. Total crashes: 111
- Southeast 122nd Ave. / Southeast Foster Rd. Total crashes: 53
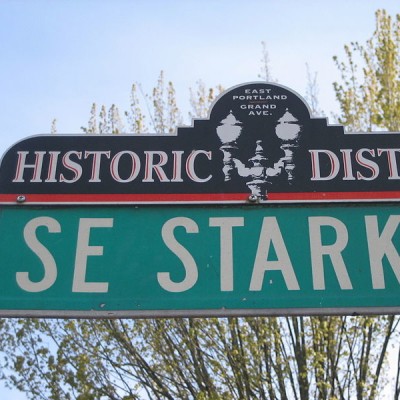
- Southeast 148th Ave. / Southeast Stark St. Total crashes: 96
*Police stats are violent crimes only. Both police and fire stats represent totals for five years
Prev
Next
#24
Lloyd
Calls for police: 4851
Fire incidents: 187
City's most dangerous intersections:
- North Broadway / North Vancouver Ave. / Northeast I5 FWY-Broadway Ramp. Total crashes: 68
- Northeast Broadway/ Northeast Grand Ave. Total crashes: 68
- North Broadway / North Williams Ave. Total crashes: 62
*Police stats are violent crimes only. Both police and fire stats represent totals for five years
Prev
Next
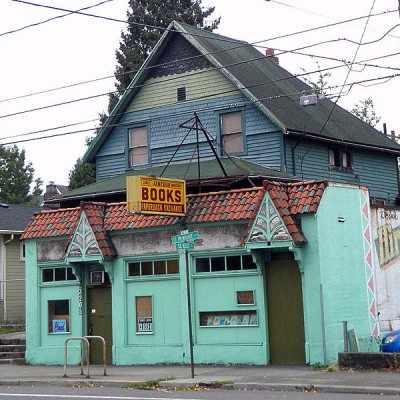
#23
Madison South
Calls for police: 1,380
Fire incidents: 112
City's most dangerous intersections:
- Northeast 82nd Ave. / Northeast Sandy Blvd. Total crashes: 57
(photo courtesy of Neighborhood Notes)
*Police stats are violent crimes only. Both police and fire stats represent totals for five years
Prev
Next
#22
Richmond
Calls for police: 2,272
Fire incidents: 117
City's most dangerous intersections:
- Southeast Cesar E. Chavez Blvd./ Southeast Powell Blvd. Total crashes: 104
- Southeast 50th Ave./ Southeast Foster Rd./ Southeast Powell Blvd. Total crashes: 53
*Police stats are violent crimes only. Both police and fire stats represent totals for five years
Prev
Next
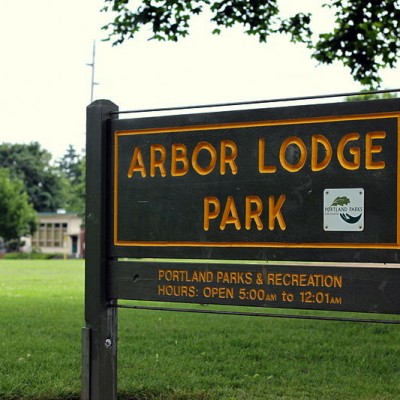
#21
Arbor Lodge
Calls for police: 1,843
Fire incidents: 81
City's most dangerous intersections:
- North Interstate Ave./ North Lombard St. Total crashes: 64
*Police stats are violent crimes only. Both police and fire stats represent totals for five years
Prev
Next
#20
Parkrose
Calls for police: 2,590
Fire incidents: 198
City's most dangerous intersections: none
*Police stats are violent crimes only. Both police and fire stats represent totals for five years
Prev
Next
#19
Northwest
Calls for police: 4,850
Fire incidents: 288
City's most dangerous intersections: none
*Police stats are violent crimes only. Both police and fire stats represent totals for five years
Prev
Next
#18
Mt. Scott-Arleta
Calls for police: 1,760
Fire incidents: 98
City's most dangerous intersections:
- Southeast 82nd Ave. / Southeast Foster Rd. Total crashes: 78
*Police stats are violent crimes only. Both police and fire stats represent totals for five years
Prev
Next
#17
Brentwood-Darlington
Calls for police: 2,038
Fire incidents: 159
City's most dangerous intersections: none
*Police stats are violent crimes only. Both police and fire stats represent totals for five years
Prev
Next
#16
Sellwood-Moreland
Calls for police: 2,243
Fire incidents: 132
City's most dangerous intersections:
- Southeast 13th Ave./ Southeast Tacoma St. Total crashes: 53
- Southeast Holgate Blvd./ Southeast McLoughlin Blvd. Total crashes: 35
*Police stats are violent crimes only. Both police and fire stats represent totals for five years
Prev
Next
#15
Eliot
Calls for police: 2,106
Fire incidents: 114
City's most dangerous intersections:
- North Broadway/ North Vancouver Ave./ Northeast I-5 FWY. Total crashes: 68
- Northeast Broadway/ Northeast Grand Ave. Total crashes: 68
- North Broadway/ North Williams Ave. Total crashes: 62
*Police stats are violent crimes only. Both police and fire stats represent totals for five years
Prev
Next
#14
St. Johns
Calls for police: 3,397
Fire incidents: 228
City's most dangerous intersections: none
*Police stats are violent crimes only. Both police and fire stats represent totals for five years
Prev
Next
#13
Portsmouth
Calls for police: 1,820
Fire incidents: 161
City's most dangerous intersections: none
*Police stats are violent crimes only. Both police and fire stats represent totals for five years
Prev
Next
#12
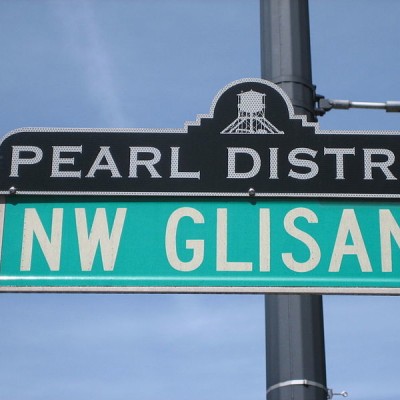
Pearl
Calls for police: 3,833
Fire incidents: 205
City's most dangerous intersections:
- Northwest Broadway/ Northwest Couch St. Total crashes: 82
*Police stats are violent crimes only. Both police and fire stats represent totals for five years
Prev
Next
#11
Kenton
Calls for police: 1,885
Fire incidents: 251
City's most dangerous intersections:
- North Interstate Ave./ North Lombard St. Total crashes: 64
*Police stats are violent crimes only. Both police and fire stats represent totals for five years
Prev
Next
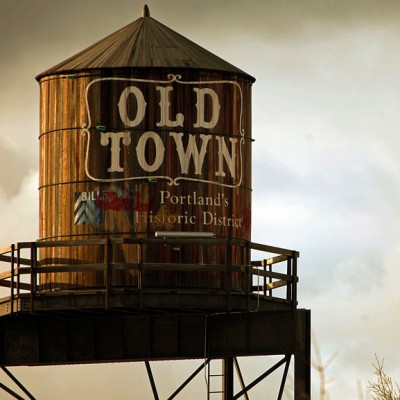
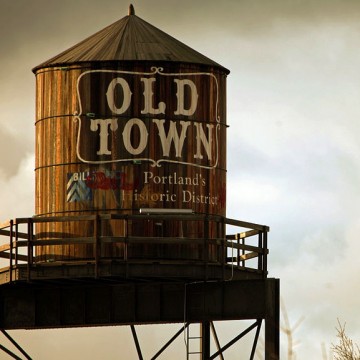
#10
China/Old Town
Calls for police: 3,258
Fire incidents: 60
City's most dangerous intersections:
- Northwest Broadway / Northwest Couch St. Total crashes: 82
*Police stats are violent crimes only. Both police and fire stats represent totals for five years
Prev
Next
#9
Downtown
Calls for police: 9,238
Fire incidents: 570
City's most dangerous intersections: none
*Police stats are violent crimes only. Both police and fire stats represent totals for five years
Prev
Next
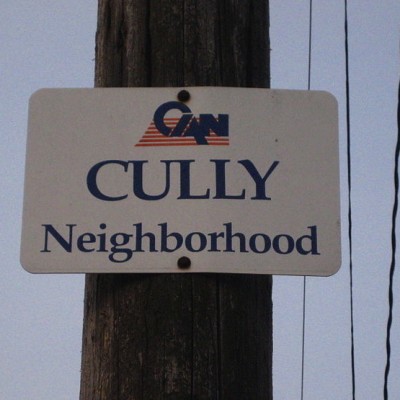
#8
Cully
Calls for police: 2,787
Fire incidents: 177
City's most dangerous intersections:
- Northeast 82nd Ave./ Northeast Killingsworth St. Total crashes: 49
- Northeast Columbia Blvd. / Northeast I-205 Southbound / Columbia Blvd. Ramps. Total crashes: 84
- Northeast 82nd Ave. / Northeast Killingsworth St.Total crashes: 49
*Police stats are violent crimes only. Both police and fire stats represent totals for five years
_400_400_90.jpg)
Prev
Next
#7
Foster-Powell
Calls for police: 2,314
Fire incidents: 125
City's most dangerous intersections:
- Southeast 82nd Ave./ Holgate Blvd. Total crashes: 68
- Southeast 82nd Ave. / Southeast Powell Blvd. Total crashes: 171
- Southeast 82nd Ave. / Southeast Foster Rd. Total crashes: 78
*Police stats are violent crimes only. Both police and fire stats represent totals for five years
Prev
Next
#6
Mill Park
Calls for police: 2,108
Fire incidents: 171
City's most dangerous intersections:
- Southeast 122nd Ave./ Southeast Stark St. Total crashes: 156
- Southeast 112th Ave. / Southeast Division St. Total crashes: 71
- Southeast 122nd Ave. / Southeast Division St. Total crashes: 170
*Police stats are violent crimes only. Both police and fire stats represent totals for five years
Prev
Next
#5
Montavilla
Calls for police: 3,695
Fire incidents: 229
City's most dangerous intersections:
- Southeast 82nd Ave./ Southeast Division St. Total crashes: 102
- Northeast 82nd Ave./ Northeast Glisan Total crashes: 98
- East Burnside St./ Northeast 82nd Ave./ Southeast 82nd Ave. Total crashes: 62
- Southeast 92nd Ave./ Southeast Division St. Total crashes: 59
- Northeast Glisan St. / Northeast Glisan St. to I-205 Southbound Ramp. Total crashes: 51
- Southeast Division St. / Southeast Division St.-I205 FWY Ramp / Southeast I205 FW0Y. Total crashes: 55
*Police stats are violent crimes only. Both police and fire stats represent totals for five years
Prev
Next
#4
Centennial
Calls for police: 5,568
Fire incidents: 254
City's most dangerous intersections:
- Southeast 174th Ave./ Southeast Powell Blvd. Total crashes: 111
- Southeast 148th Ave./ Southeast Division St. Total crashes: 69
- Southeast 162nd Ave./ Southeast Division St. Total crashes: 92
- Southeast 174th Ave./ Southeast Division St. Total crashes: 56
- Southeast 162nd Ave. / Southeast Stark St. Total crashes: 55
*Police stats are violent crimes only. Both police and fire stats represent totals for five years
Prev
Next
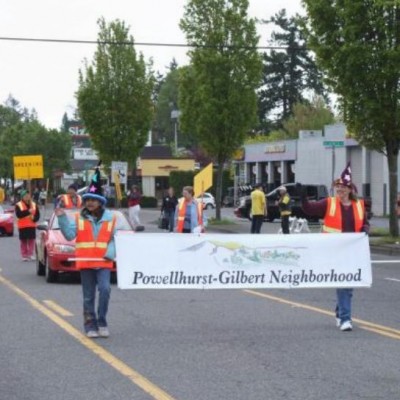
#3
Powelhurst-Gilbert
Calls for police: 6,025
Fire incidents: 394
City's most dangerous intersections:
- Southeast 122nd Ave./ Southeast Division St. Total crashes: 170
- Southeast 122nd Ave./ Southeast Powell Blvd. Total crashes: 125
- Southeast 136 Ave./ Southeast Powell Blvd. Total crashes: 77
- Southeast 112th Ave./ Southeast Powell Blvd. Total crashes: 56
- Southeast 96th Dr./ Southeast Division St./ Southeast I-205 Northbound to Division. Total crashes: 79
- Southeast 122nd Ave./ Southeast Foster Rd. Total crashes: 53
- Southeast 82nd Ave. / Southeast Division St. Total crashes: 102
- Southeast 92nd Ave. / Southeast Powell Blvd. Total crashes: 99
- Southeast 92nd Ave. / Southeast Division St. Total crashes: 59
- Southeast Division St. / Southeast Division St-I205 Fwy Ramp / Southeast I205. Total crashes: 55
- Southeast 82nd Ave. / Southeast Powell Blvd. Total crashes: 171
- Southeast 112th Ave. / Southeast Division St. Total crashes: 71
*Police stats are violent crimes only. Both police and fire stats represent totals for five years
Prev
Next
#2
Lents
Calls for police: 6,973
Fire incidents: 419
City's most dangerous intersections:
- Southeast 92nd Ave./ Southeast Powell Blvd. Total crashes: 99
- Southeast 92nd Ave./ Southeast Holgate Blvd. Total crashes: 67
- Southeast 82nd Ave./ Southeast Foster Rd. Total crashes: 78
- Southeast 92nd Ave./ Southeast Foster Rd. Total crashes: 64
- Southeast Foster Rd./ Southeast 96th Ave./ Southeast Foster to I-205. Total crashes: 59
- Southeast 82nd Ave./ Southeast Flavel St. Total crashes: 49
- Southeast Foster Rd./ Southeast 94th Ave./ I-205 FWY. Total crashes: 49
- Southeast 82nd Ave. / Southeast Holgate Blvd. Total crashes: 68
- Southeast 82nd Ave. / Southeast Powell Blvd. Total crashes: 171
*Police stats are violent crimes only. Both police and fire stats represent totals for five years
**This slide previously included the intersection "Southesat Holgate Blvd./Southeast Mcloughlin Blv." which is not in the Lents neighborhood. It has since been removed**
Prev
Next
#1
Hazelwood
Calls for police: 10,136
Fire incidents: 483
City's most dangerous intersections:
- Northeast 122nd Ave./ Northeast Glisan St. Total crashes: 144
- Northeast 102nd Ave./ Northeast Glisan St. Total crashes: 110
- Northeast Glisan St./ Northeast Glisan St. to I-205 Northbound ramp. Total crashes: 87
- Southeast 96th Ave./ Southeast 99th Ave./ Southeast Washington St. Total crashes: 66
- Southeast 112th Ave./ Southeast Division St. Total crashes: 71
- Northeast Glisan St./ Northeast Glisan St. to I-205 Southbound ramp. Total crashes: 51
- Southeast 102nd Ave./ Southeast Stark St. Total crashes: 54
- Southeast Division St./Southeast Division St. to I-205 ramp. Total crashes: 55
- Northeast 99th Ave./ Northeast Glisan St. Total crashes: 53
- 122nd Ave. / Southeast Stark St. Total crashes: 156
- Southeast 136th Ave. / Southeast Powell Blvd. Total crashes: 77
- Southeast 148th Ave. / Southeast Stark St. Total crashes: 96
- Southeast 96th Dr. / Southeast Division St. / Southeast I-205 Northbound ramp to Division St. ramp. Total crashes: 79
- Northeast 102nd Ave. / Northeast Halsey St. Total crashes: 56
- Northeast 122nd Ave. / Northeast Halsey St. Total crashes: 99
*Police stats are violent crimes only. Both police and fire stats represent totals for five years
Related Files
Related Articles
Enjoy this post? Share it with others.
Email to a friend
Permalink

_360_360_90.jpg)


_80_80_90_c1.jpg)


 Delivered Free Every
Follow us on Pinterest Google + Facebook Twitter See It Read It