Oregon is One of the Top States with Most Mass Shootings


 Email to a friend
Permalink
Email to a friend
Permalink
Thursday, October 01, 2015
Jack Rushall, GoLocalPDX Contributor
According to The Stanford Geospatial Center, Oregon lists high compared to other states in terms of mass shootings that took place between the years of 1966 to 2014.
In light of the mass shooting today at Umpqua Community College, it looks like Oregon has now experienced four mass killings since 1944, bringing it within the top fifteen most dangerous states in the U.S. in terms of mass shootings.
According to the data released, here are the number of mass shootings that have taken place by state from 1966 through 2014:
25= California
10= Texas
9= Washington
7= Florida
7= Illinois
6= Ohio
6= Wisconsin
6= Arizona
5= Georgia
5= New York
5= Michigan
4= Pennsylvania
4= Oklahoma
4= Kentucky
4= Colorado
4= Alabama
4= North Carolina
4= South Carolina
4= Nevada
3= Oregon
3= Connecticut
2= Massachusetts
2= New Jersey
2= Louisianna
2= Utah
2= Arkansas
2= Minnesota
2= Virginia
2= Mississippi
1= Montana
1= Wyoming
1= Nebraska
1= Missouri
1= Hawaii
1= Kansas
1= New Mexico
1= Alaska
1= Iowa
1= Tennessee
1= Vermont
0= Indiana
0= Maine
0= Maryland
0= Rhode Island
0= North Dakota
0= South Dakota
0= Idaho
0= Delaware
0= New Hampshire
0= West Virginia
The Umpqua Community College shooting is Oregon's 4th mass shooting since 1966.
Related Slideshow: Top 10 Oregon Cities for Hate Crimes
Every year, the FBI releases hate crime statistics from around the state. Check out what the worst towns for hate crimes were in 2013.

Prev
Next
#10
Bend
Total Hate Crimes: 3
Types of Hate Crimes: 2 against religion, 1 against ethnicity
Hate Crimes Per 1,000 People: 0.038
Photo: Farewell Bend Park, via Wikimedia Commons

Prev
Next
#9
Newberg-Dundee
Total Hate Crimes: 1
Type of Hate Crime: 1 against ethnicity
Hate Crimes Per 1,000 People: 0.039
Photo: Newberg Public Library, Stuart Seeger on Flickr
Prev
Next
#8
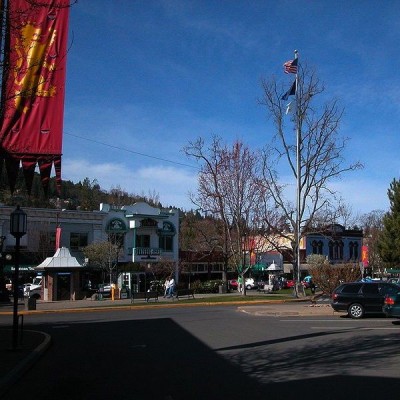
Ashland
Total Hate Crimes: 1
Type of Hate Crime: 1 against race
Hate Crimes Per 1,000 People: 0.049
Photo Credit: The Plaza in Ashland, via Wikimedia Commons

Prev
Next
#7
Springfield
Total Hate Crimes: 3
Types of Hate Crimes: 2 against race, 1 against ethnicity
Hate Crimes Per 1,000 People: 0.050
Photo: Gateway Mall in Springfield

Prev
Next
#6
Salem
Total Hate Crimes: 14
Types of Hate Crimes: 7 against race, 1 against religion, 4 against sexual orientation, 2 against ethnicity
Hate Crimes Per 1,000 People: 0.088

Prev
Next
#5
Eugene
Total Hate Crimes: 15
Types of Hate Crimes: 6 against race, 4 against religion, 3 against sexual orientation, 2 against ethnicity
Hate Crimes Per 1,000 People: 0.095
Photo: University of Oregon in Eugene
Prev
Next
#4
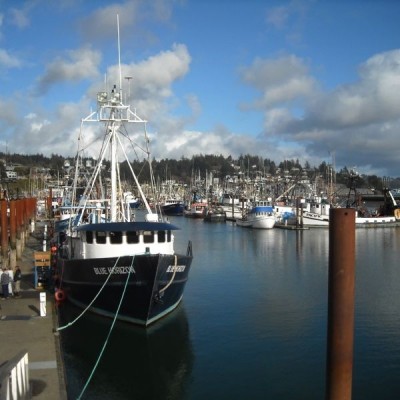
Newport
Total Hate Crimes: 1
Type of Hate Crime: 1 against sexual orientation
Hate Crimes Per 1,000 People: 0.10
Photo: Harbor in Yaquina Bay, Newport, via Wikimedia Commons

Prev
Next
#3
Sutherlin
Total Hate Crimes: 1
Type of Hate Crime: 1 against race
Hate Crimes Per 1,000 People: 0.129
Photo: Brett Spangler on Flickr
Prev
Next
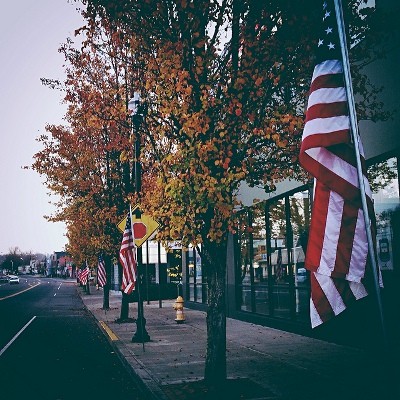
#2
Tigard
Total Hate Crimes: 9
Types of Hate Crimes: 8 against race, 1 against ethnicity
Hate Crimes Per 1,000 People: 0.179
Photo: Loren Kerns on Flickr
Prev
Next
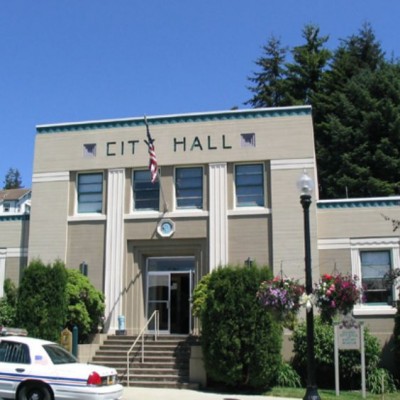
#1
Toledo
Total Hate Crimes: 4
Types of Hate Crimes: 2 against race, 1 against sexual orientation, 1 against disability
Hate Crimes Per 1,000 People: 1.156
Photo: Toledo city hall, via Wikimedia Commons
Related Articles
Enjoy this post? Share it with others.
Email to a friend
Permalink


 Delivered Free Every
Follow us on Pinterest Google + Facebook Twitter See It Read It