Oregon Receives Mediocre Ratings on Gallup Nation Wide Wellness Poll


 Email to a friend
Permalink
Email to a friend
Permalink
Thursday, February 19, 2015
Kai Soderberg, GoLocalPDX Contributor

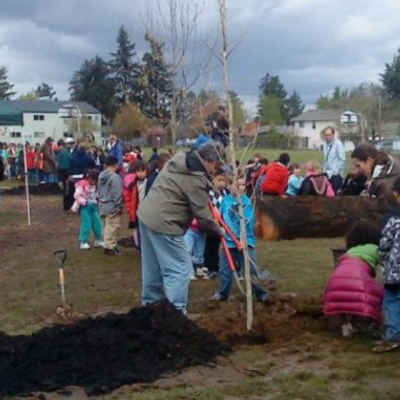
Gallup defines social wellness as having supportive relationships and love in your life
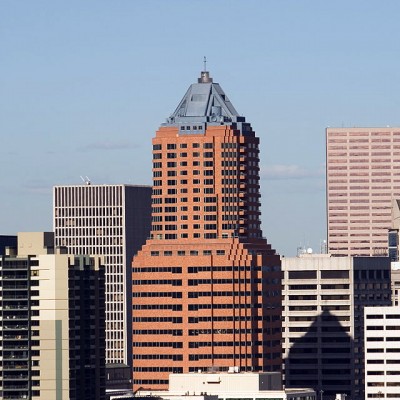
Oregonians recieved a mediocre rating for social wellness on a new Gallup study. Oregon ranks 24 out of the 50 states for social wellness, which Gallup defines as "having supportive relationships and love in your life."
South Dakotans rank highest on the list, while Rhode Islanders finish dead last.
Gallup released their findings after interviewimg 176,702 adults across all States in the Union. Click here for a summary of their findings.
Social wellness is one of five measures that Gallup uses in its overall evaluation of resident health. The other criteria are community connectedness, physical health, sense of purpose and financial wellbeing. So, thanks to Rhode Islanders’ relative physical fitness, they finish at 37 for overall wellbeing. It’s certainly not great, but a lot better than 50. Too much time spent in the gym listening to headphones?
Incidentally, the Gallup finds the two states located outside of the lower 48 ranking highest in overall wellbeing; Alaska leads the nation and Hawaii follows at a close second.
Oregonian’s stay in the middle for nearly every category except for sense of purpose: “Liking what you do each day and being motivated to achieve your goals,” in which they finish at 41. Perhaps the city where people go to retire has dragged the state down a couple notches in this category.
Overall, Oregon finishes at number 27 beating our neighbors to the North by one rank (although they have an edge on our financial wellbeing and our sense of purpose).
The lowest ranking state is West Virginia, which ranks dead last in the physical and sense of purpose categories, followed by Kentucky. Both states have held their respective positions in the 50th and 49th slot for the past six years. All other states in the bottom ten are located either in the South or the Midwest.
The highest-ranking states after Alaska and Hawaii start in Montana and proceed south through the Rockies all the way down to Texas.
Those of us in the Pacific Northwest, it turns out, are as temperate as the climate we live in. Neither hot nor cold, we take one day at a time in even stride.
But is this really a surprise to any of us?
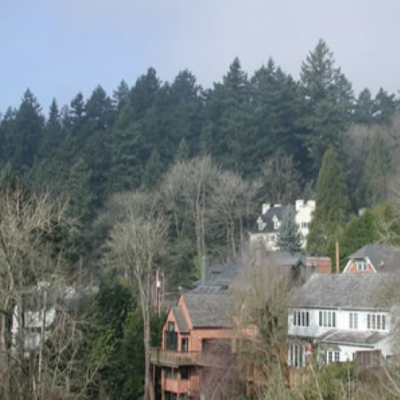
Related Slideshow: 15 Portland Area Neighborhoods With Fastest Growing Poverty
A report from the City Observatory revealed the increasing poverty rates in the Portland metro-area for census tracks. Find which areas saw the highest increases in poverty.
Prev
Next
#15
Eliot
Poverty rate in 1970: 38 percent
Poverty rate in 2010: 34 percent
Decrease in poverty rate: 4 percent
Prev
Next
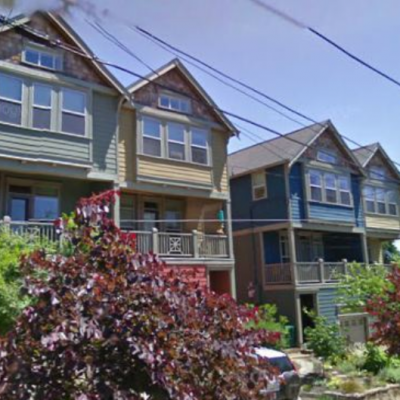
#14
Humboldt
Poverty rate in 1970: 32 percent
Poverty rate in 2010: 34 percent
Increase in poverty rate: 2 percent

Prev
Next
#13
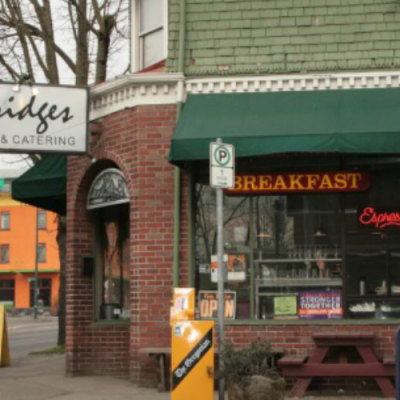
Buckman
Poverty rate in 1970: 29 percent
Poverty rate in 2010: 32 percent
Increase in poverty rate: 3 percent

Prev
Next
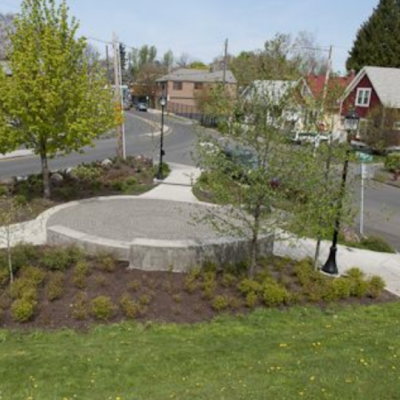
#12
West Portsmouth
Poverty rate in 1970: 25 percent
Poverty rate in 2010: 30 percent
Increase in poverty rate: 5 percent
Prev
Next
#11
North King
Poverty rate in 1970: 19 percent
Poverty rate in 2010: 31 percent
Increase in poverty rate: 12 percent

Prev
Next
#10
South Downtown
Poverty rate in 1970: 25 percent
Poverty rate in 2010: 39 percent
Increase in poverty rate: 14 percent
Prev
Next
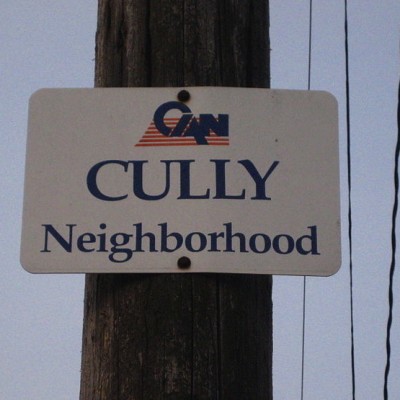
#9
East Cully & North Roseway
Poverty rate in 1970: 15 percent
Poverty rate in 2010: 31 percent
Increase in poverty rate: 16 percent
Prev
Next
#8
North Downtown
Poverty rate in 1970: 36 percent
Poverty rate in 2010: 52 percent
Increase in poverty rate: 16 percent
Prev
Next
#7
Goose Hollow
Poverty rate in 1970: 21 percent
Poverty rate in 2010: 40 percent
Increase in poverty rate: 19 percent
Prev
Next
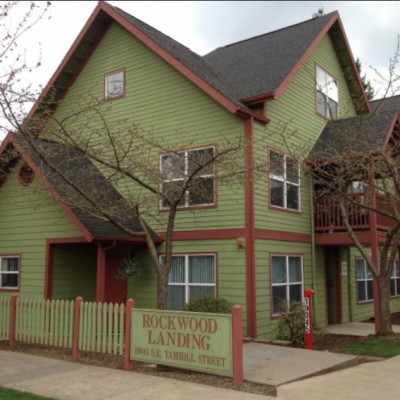
#6
Rockwood & North Centennial in Gresham
Poverty rate in 1970: 10 percent
Poverty rate in 2010: 30 percent
Increase in poverty rate: 20 percent
Prev
Next
#5
University Park
Poverty rate in 1970: 10 percent
Poverty rate in 2010: 32 percent
Increase in poverty rate: 22 percent
Prev
Next
#4
Central Powelhurst-Gilbert
Poverty rate in 1970: 11 percent
Poverty rate in 2010: 35 percent
Increase in poverty rate: 24 percent
Prev
Next
#3
Maple Wood, Bagley Downs Neighborhood & Meadow Homes Neighborhood in Vancouver
Poverty rate in 1970: 5 percent
Poverty rate in 2010: 31 percent
Increase in poverty rate: 26 percent
Prev
Next
#2
Glenfair & South Wilkes
Poverty rate in 1970: 5 percent
Poverty rate in 2010: 34 percent
Increase in poverty rate: 29 percent
Prev
Next
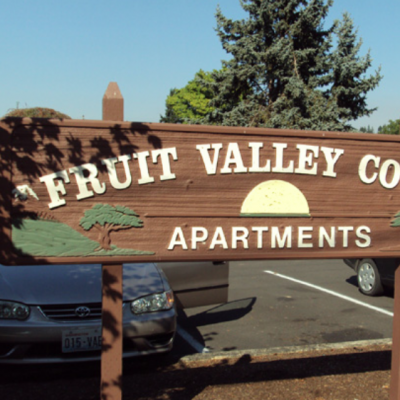
#1
Fruit Valley in Vancouver
Poverty rate in 1970: 5 percent
Poverty rate in 2010: 36 percent
Increase in poverty rate: 31 percent
Related Articles
Enjoy this post? Share it with others.
Email to a friend
Permalink


Follow us on Pinterest Google + Facebook Twitter See It Read It